


Platinum (XPTUSD) Is down 2.01% on Jul 17: What Changed in Supply and Demand?
Platinum (XPTUSD) is down 2.01% at Jul 17 03:10(ET), now at $1587.82, with a 7-day down of 2.72%.
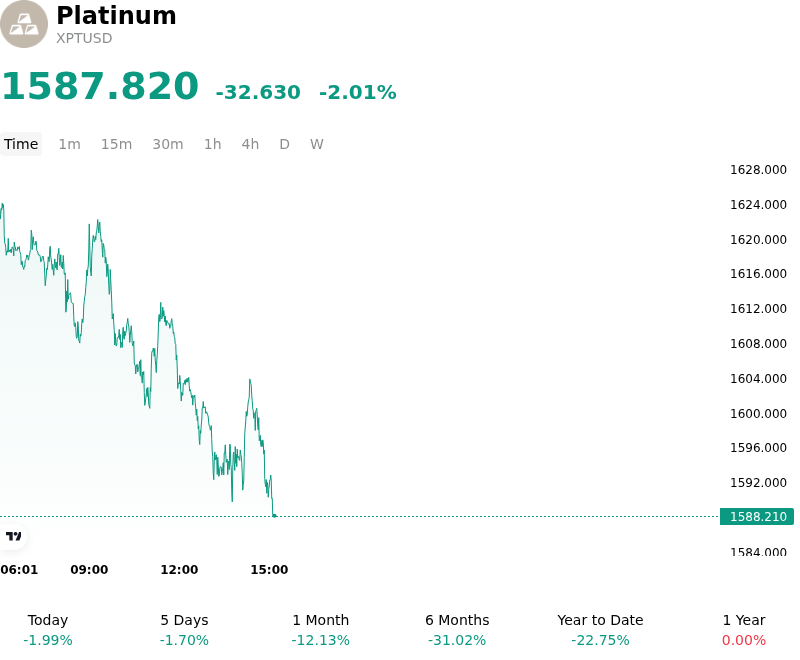
What is driving Platinum (XPTUSD)’s stock price down today?
The decline in platinum prices is primarily driven by a sharp repricing of global monetary policy expectations following a robust set of US economic data and hawkish commentary from Federal Reserve officials. Higher-than-anticipated inflation readings have reinforced the narrative of sustained elevated interest rates, fueling a surge in US Treasury yields and the US dollar index. As a non-yielding asset, platinum remains highly sensitive to shifts in real yields. The resulting dollar strength has applied immediate downward pressure on the metal, as it becomes more expensive for international buyers, particularly in key consuming regions like China and the European Union.
From a fundamental perspective, the market is reacting to emerging data suggesting a slowdown in the production of internal combustion engine and hybrid vehicles. Since the automotive sector accounts for the largest share of global platinum demand through its use in catalytic converters, any downward revision in vehicle production forecasts materially impacts the demand outlook. Institutional investors are closely monitoring reports of rising inventory levels at major car manufacturers, which suggests that the previous deficit expectations for the year may be narrowing. This softening in industrial demand is offsetting the structural supply risks typically associated with South African production, as recent improvements in regional energy stability have allowed for more consistent mining operations and refinery throughput.
Institutional capital flows indicate a shift toward profit-taking as platinum fails to sustain its recent price floor. The breach of key technical support levels has triggered systematic selling and a reduction in net-long positions among managed money participants. Furthermore, the persistent discount of platinum relative to gold has failed to attract significant safe-haven interest, as investors prioritize liquidity and yield in a high-rate environment. Until there is a clear catalyst for a recovery in industrial manufacturing activity or a dovish pivot in central bank rhetoric, the market balance appears tilted toward a surplus in the near term, keeping prices under significant pressure.
Technical Analysis of Platinum (XPTUSD)
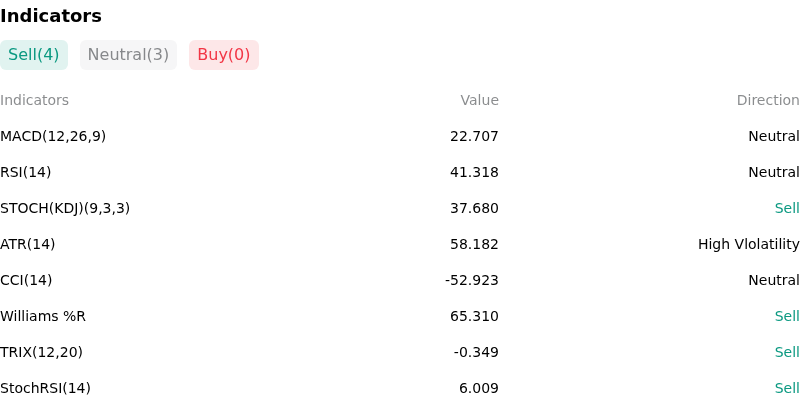
Technically, Platinum (XPTUSD) shows a MACD (12,26,9) value of 22.707, indicating a neutral signal. The RSI at 41.318 suggests neutral condition and the Williams %R at 65.310 suggests sell condition. Please monitor closely.
More details about Platinum (XPTUSD)
Recent Events and Risks:
- U.S. Dollar Appreciation and Interest Rate Shifts: Recent hawkish signals from Federal Reserve officials and resilient U.S. economic data have driven the U.S. Dollar Index (DXY) higher, creating immediate downward pressure on platinum as a dollar-denominated asset and reducing its appeal compared to interest-bearing instruments.
- Industrial Demand Concerns in China: Weakness in recent Chinese manufacturing and property sector data has heightened fears of slowing industrial consumption for platinum, particularly in the chemical and glass manufacturing industries which are critical for non-automotive demand stability.
- Automotive Sector Headwinds in Europe: A stagnation in European diesel vehicle registrations over the last 72 hours, coupled with profit warnings from major regional automakers, suggests a near-term decline in autocatalyst demand, further straining the metal’s primary consumption channel.
- Technical Support Breach and Liquidity Stress: XPTUSD has faced intensified selling pressure after failing to hold key technical support levels, triggering stop-loss orders and long liquidations in a relatively thin liquidity environment that amplifies intraday downside volatility.
Recommended Articles


