


Are South Korean traders returning to crypto after the KOSPI crash?
The South Korean KOSPI index crashed by 8.95% in a single day, with a 15% intraday drop. This triggered a circuit breaker on the market, showing the recent KOSPI rally was fragile.
KOSPI broke its rally in June, with a maximum value of 9,155 points. In the past month, the index has been sliding rapidly, plunging below the 6,800 range.
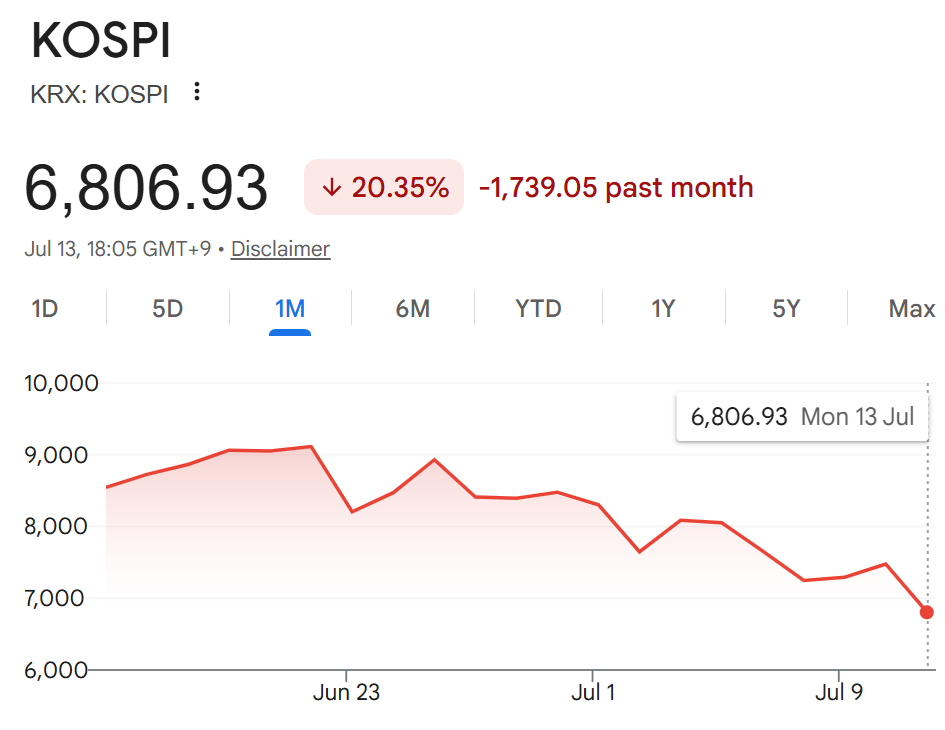
As Cryptopolitan reported, KOSPI trading was highly leveraged, and more positions may await liquidation.
The rapid rise of the KOSPI index also took some of the liquidity from South Korean crypto markets. This also meant KOSPI was boosted by retail inflows, which may be more unstable and lead to panic selling.
The South Korean HYNIX index also slid by over 19% in the past week, reflecting the tidal shift of the recent rally.
KOSPI signals the unwinding of the AI and semiconductor trade
The South Korean trade was heavily dependent on the semiconductor sector. KOSPI currently trades at a price/earnings ratio of 6.4% for forward earnings. As semiconductor earnings climbed, the index traded at the lowest ratio since the 2008 financial crisis. This does not mean the KOSPI is still cheap, but rather a distrust of the possibility of keeping up semiconductor sales at these levels.
As the index is highly dependent on semiconductor sales, the current drawdown reflects a worsening confidence in sales for the upcoming quarters.
The recent circuit breaker event shows the unwinding is more chaotic than expected, potentially leading to a further crash and liquidations. For KOSPI, this is the seventh circuit breaker event in 2026, showing the market’s potential fragility and exposure to sentiment shifts.
The unwinding of the AI trade in South Korea may also affect other sectors. The recent market crash further revealed the risk-off attitudes for risky assets. A slide in KOSPI may have diverse effects on crypto, either moving retail investors back to BTC and tokens or creating a bigger risk-off wave of selling.
Can the KOSPI slide affect crypto markets?
Coinciding with the recent KOSPI crash, BTC also rejected the $64,000 level. BTC moved down to a lower range, later recovering to $63,000.
The KOSPI slide also caused more turbulent trading of stock perpetual futures on Hyperliquid. Samsung fell by 8.38% in the past day, with peak volumes. The correction in semiconductor markets may affect trading on HIP-3, leading to liquidations and liquidity.
The KOSPI crash is still watched for its contagion potential. US markets are waiting to react to Asia’s closing. If stock sentiment shifts, overall crypto selling may worsen. The KOSPI crash may have repercussions across markets and asset classes, once again breaking the BTC recovery.
In 2026, BTC and crypto behaved as a risk-on asset, meaning any shocks to other sectors often caused a negative reaction. The index is trading with a strong sell recommendation, as pressure comes from South Korean retail liquidations. Additionally, the KOSPI rally invited foreign buyers, who started divesting at the end of June.
At its 2026 peak, KOSPI accrued 122% in net gains for the year to date. After the recent crash, the net gain shrank to around 60%.
Don’t just read crypto news. Understand it. Subscribe to our newsletter. It's free.
Recommended Articles


