


Gold declines as renewed US-Iran hostilities boost Oil prices, Fed rate hike bets
- Gold falls as renewed Middle East tensions lift Oil prices, reviving inflation concerns.
- Higher interest rate expectations continue to weigh on the non-yielding metal.
- XAU/USD struggles below the Bollinger mid-band, with sellers eyeing the $4,000 support level.
Gold (XAU/USD) starts the week on the back foot as renewed tensions in the Middle East lift Oil prices and bring inflation concerns back into focus, reinforcing expectations of a Federal Reserve (Fed) interest rate hike later this year.
At the time of writing, XAU/USD trades around $4,061, down 1.44% on the day after touching an intraday low of $4,045.
The US and Iran exchanged missile and drone attacks over the weekend. Washington struck southern Iran, while Tehran targeted US military facilities across the Gulf.
Tehran claimed it had once again closed the Strait of Hormuz. However, the US maintains that the waterway remains open and says it is escorting vessels.
The US Dollar (USD) and crude Oil prices opened the week higher, putting pressure on the precious metal, although both have since given back some of their earlier gains.
WTI trades around $73.75, up nearly 3.25% on the day but below its intraday high of $74.96. The US Dollar Index (DXY), which tracks the Greenback’s value against a basket of six major currencies, slips back below 101.00 after touching an intraday high of 101.22.
Gold is struggling to recover as the prospect of higher interest rates remains a key headwind. “Stabilizing US labor market conditions and sticky inflation will keep Fed funds rate pricing hawkish,” analysts at Brown Brothers Harriman (BBH) said.
BBH added that markets have fully priced in a 25-basis-point (bps) rate hike by year-end and nearly 50 bps of tightening over the next twelve months.
Higher borrowing costs generally weigh on Gold by increasing the opportunity cost of holding non-yielding assets.
With the economic calendar largely empty on Monday, traders now turn their attention to the US Consumer Price Index (CPI) data due on Tuesday. Fed Chair Kevin Warsh’s congressional testimony will also be closely watched for fresh clues about the central bank’s interest rate outlook.
Technical analysis: XAU/USD stays under pressure with $4,000 in focus
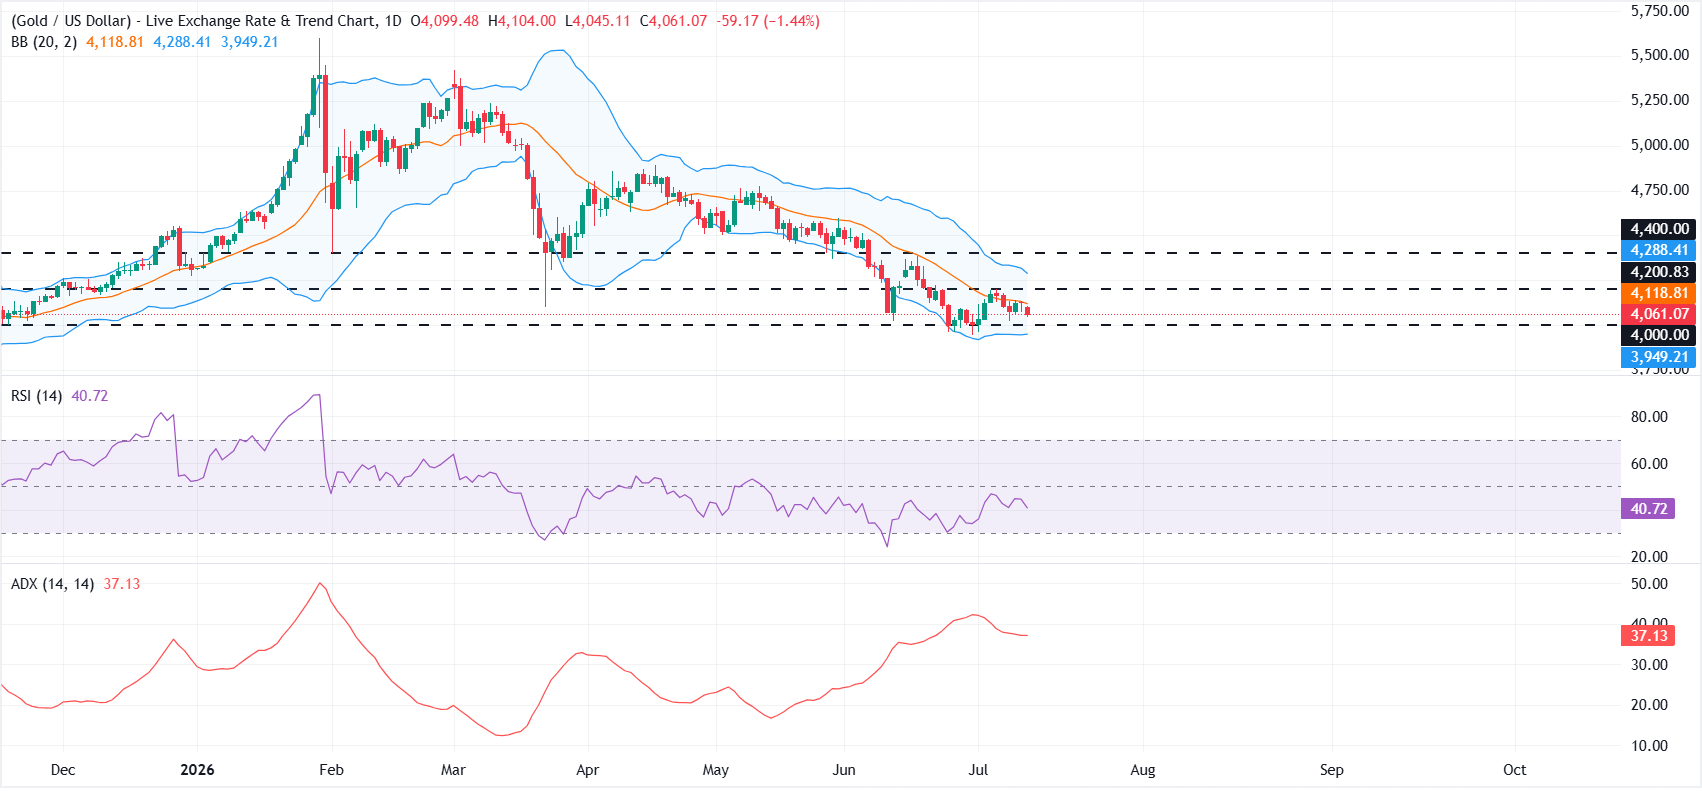
On the daily chart, XAU/USD maintains a bearish bias, trading below the 20-day Bollinger Band middle line near $4,118.50. The Relative Strength Index (RSI) stands around 40, remaining below the neutral 50 threshold and reinforcing the bearish outlook.
Meanwhile, the Average Directional Index (ADX) near 37 indicates that the broader downtrend remains well defined, suggesting recovery attempts could remain limited unless Gold reclaims the Bollinger mid-band.
On the topside, initial resistance emerges at the 20-day Bollinger SMA around $4,118.50, followed by a horizontal cap at $4,200 and then the upper Bollinger band near $4,288.50, with a stronger barrier at $4,400.
On the downside, immediate support is aligned with the $4,000 horizontal floor, ahead of the lower Bollinger band clustering around $3,948.50, where a break would open the door to a deeper corrective phase.
(The technical analysis of this story was written with the help of an AI tool. Know more.)
Gold FAQs
Gold has played a key role in human’s history as it has been widely used as a store of value and medium of exchange. Currently, apart from its shine and usage for jewelry, the precious metal is widely seen as a safe-haven asset, meaning that it is considered a good investment during turbulent times. Gold is also widely seen as a hedge against inflation and against depreciating currencies as it doesn’t rely on any specific issuer or government.
Central banks are the biggest Gold holders. In their aim to support their currencies in turbulent times, central banks tend to diversify their reserves and buy Gold to improve the perceived strength of the economy and the currency. High Gold reserves can be a source of trust for a country’s solvency. Central banks added 1,136 tonnes of Gold worth around $70 billion to their reserves in 2022, according to data from the World Gold Council. This is the highest yearly purchase since records began. Central banks from emerging economies such as China, India and Turkey are quickly increasing their Gold reserves.
Gold has an inverse correlation with the US Dollar and US Treasuries, which are both major reserve and safe-haven assets. When the Dollar depreciates, Gold tends to rise, enabling investors and central banks to diversify their assets in turbulent times. Gold is also inversely correlated with risk assets. A rally in the stock market tends to weaken Gold price, while sell-offs in riskier markets tend to favor the precious metal.
The price can move due to a wide range of factors. Geopolitical instability or fears of a deep recession can quickly make Gold price escalate due to its safe-haven status. As a yield-less asset, Gold tends to rise with lower interest rates, while higher cost of money usually weighs down on the yellow metal. Still, most moves depend on how the US Dollar (USD) behaves as the asset is priced in dollars (XAU/USD). A strong Dollar tends to keep the price of Gold controlled, whereas a weaker Dollar is likely to push Gold prices up.
Recommended Articles


