

Pi Network Price Forecast: PI flashes early reversal signals at the last line of defense

Source Fxstreet
  • Pi Network edges lower on Tuesday, marking its fourth consecutive day of losses.
  • Broader market risk appetite remains weak, limiting the upside potential for altcoins.
  • The technical outlook for PI is mildly optimistic, supported by a bullish RSI divergence emerging at a key support level.

Pi Network (PI) is trading near its lowest level at $0.1100 on Tuesday, under intense downside pressure. PI remains vulnerable to steeper corrections, with its fourth straight day of losses amid weak market-wide risk appetite. 

Technically, PI hopes for a potential rebound supported by a bullish divergence in the Relative Strength Index (RSI). 

Broader market risk-off sentiment weighs down PI token

The broader crypto market sentiment remains primarily bearish, with the Fear and Greed Index at 28 on Tuesday, reflecting a sell-side dominance. Although sentiment has recovered from the “Extreme Fear” zone, PI tokens struggle to regain strength, reflecting a lack of reliance on speculative demand.
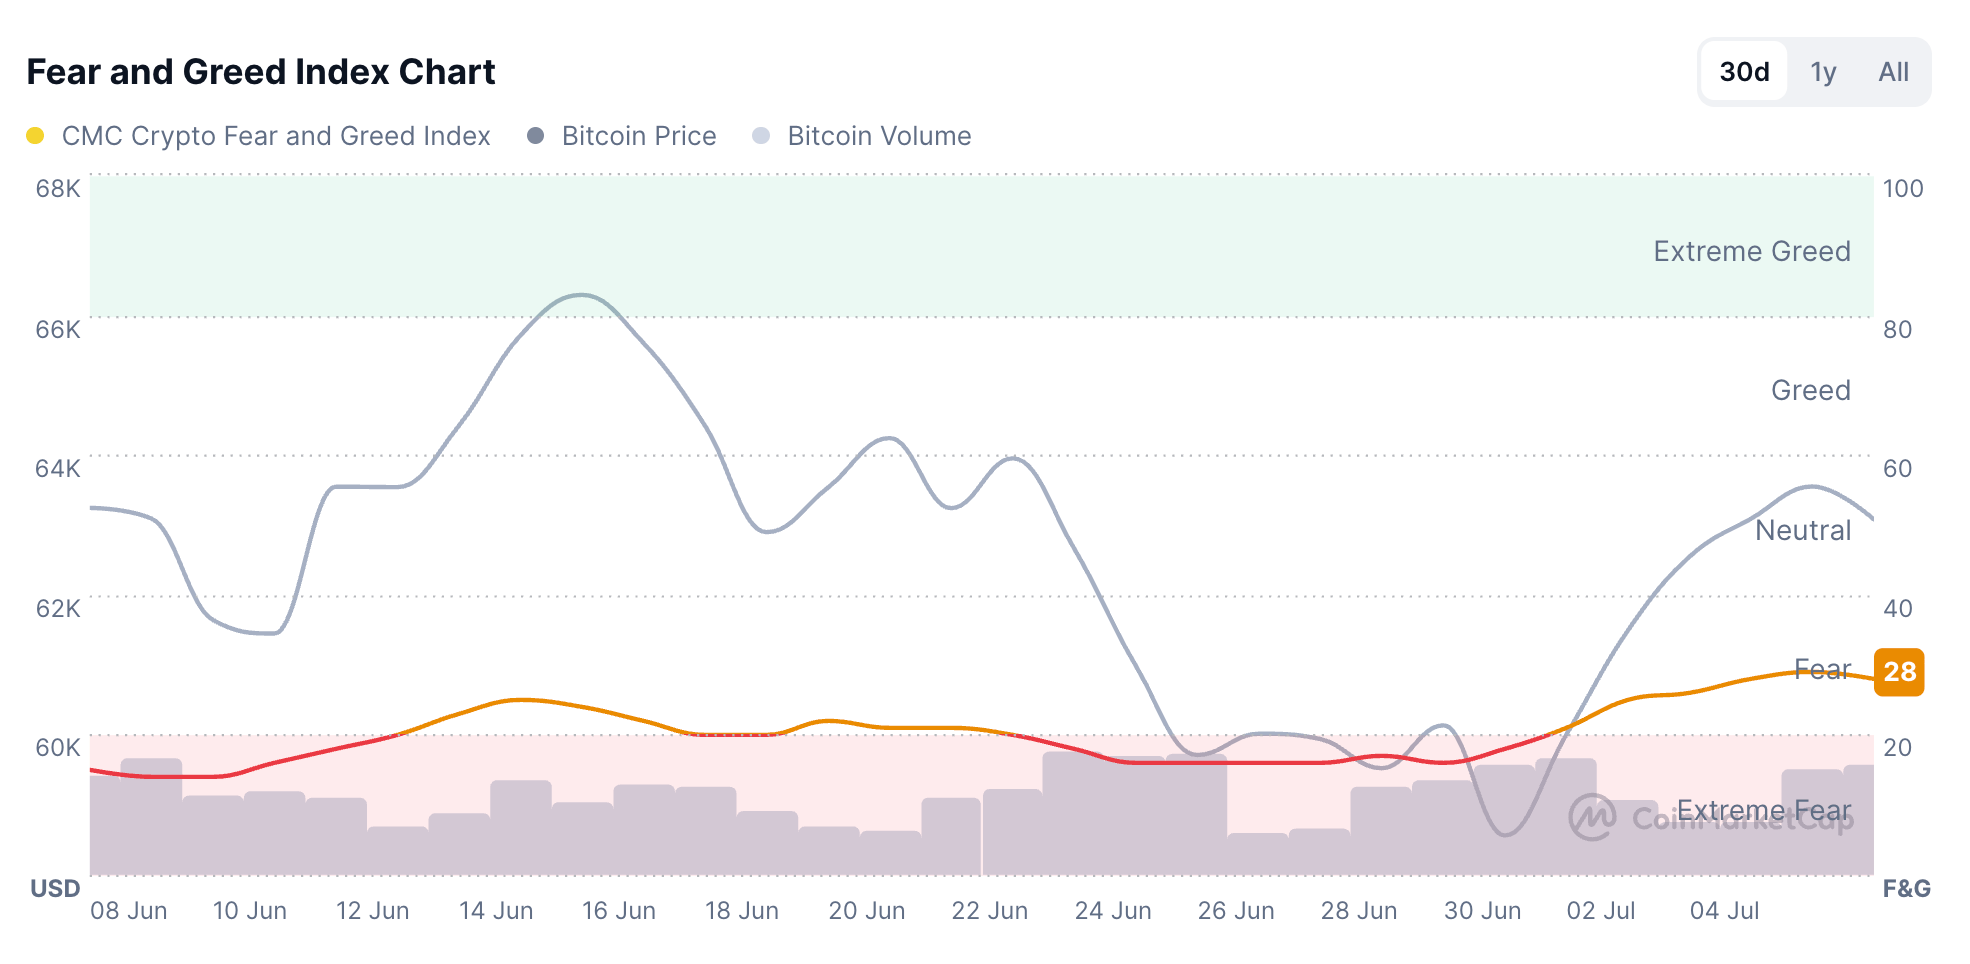
Fear and Greed Index. Source: CoinMarketCap

Will PI token bounce back?

Pi Network holds above $0.1100 at press time on Tuesday amid a broadly bearish trend. From a technical perspective, PI is holding at its last recorded support level of $0.1111 from June 30. A slip below this zone could plunge PI into downside price discovery, potentially targeting the $0.1000 psychological threshold.

That said, the Relative Strength Index (RSI) at 33 on the 4-hour chart indicates a mild bullish divergence relative to the previous bottom on June 30, suggesting a possible rebound ahead. Meanwhile, the Moving Average Convergence Divergence (MACD) indicator sits marginally below its signal line, with a negative histogram contraction, reinforcing a subdued downside momentum profile.

Chart Analysis PI/USD (baha Crypto)
PI/USD daily price chart.

Looking up, a potential rebound could face the 50-period Exponential Moving Average (EMA) at $0.1171 on the 4-hour chart, followed by the 50% retracement level at $0.1220, measured over the downswing from $0.1341 to $0.1111.

(The technical analysis of this story was written with the help of an AI tool. Know more.)

Disclaimer: For information purposes only. Past performance is not indicative of future results.
placeholder
Gold Price Analysis (XAU/USD): Gold Falls to 6-Month Low as Inflation Fuels Rate Hike Bets, A Buying Opportunity or a Falling Knife? Gold hit a 6-month low on Fed rate hike bets. However, strong central bank buying and technical indicators suggest potential tactical bounces and long-term accumulation windows.
Author  Mitrade Team
6 Month 12 Day Fri
Gold hit a 6-month low on Fed rate hike bets. However, strong central bank buying and technical indicators suggest potential tactical bounces and long-term accumulation windows.
placeholder
XRP Price Prediction for July 2026: Can Buyers Finally Break the Downtrend?XRP (XRP) price trades near $1.05, caught between a year-long downtrend and a sudden burst of buying.July has historically rewarded XRP holders. This year the month arrives with on-chain accumulation
Author  Beincrypto
6 Month 30 Day Tue
XRP (XRP) price trades near $1.05, caught between a year-long downtrend and a sudden burst of buying.July has historically rewarded XRP holders. This year the month arrives with on-chain accumulation
placeholder
Smart Money is Leaving Nvidia for This AI Chip StockNvidia stock price keeps sliding, yet the usual dip buyers are missing. Institutional money flow on the stock is the most negative of any major chip name, which means big investors are stepping back i
Author  Beincrypto
6 Month 30 Day Tue
Nvidia stock price keeps sliding, yet the usual dip buyers are missing. Institutional money flow on the stock is the most negative of any major chip name, which means big investors are stepping back i
placeholder
What to Expect From Ethereum (ETH) in July 2026Ethereum (ETH) enters July 2026 trading near $1,570, close to multi-month lows, after recording its first run of three consecutive red quarterly candles in its history.On-chain data and price charts n
Author  Beincrypto
7 Month 01 Day Wed
Ethereum (ETH) enters July 2026 trading near $1,570, close to multi-month lows, after recording its first run of three consecutive red quarterly candles in its history.On-chain data and price charts n
placeholder
NVIDIA Price Forecast: Michael Burry Shorts NVDA, but Analysts See $299On July 1, NVIDIA (NASDAQ: NVDA) sits at $198.34, failing to break above the former support level that is now serving as resistance between $198 and $205 on the 2H chart's downward blue c
Author  TradingKey
7 Month 02 Day Thu
On July 1, NVIDIA (NASDAQ: NVDA) sits at $198.34, failing to break above the former support level that is now serving as resistance between $198 and $205 on the 2H chart's downward blue c
goTop
quote