


Bitcoin Price Forecast: BTC struggles despite renewed ETF inflows as Strategy sale impact fades
- Bitcoin declines below $63,500 on Tuesday, snapping a streak of six consecutive days of gains.
- Spot ETFs recorded an inflow of around $265 million on Monday, marking the second day of inflows following weeks of withdrawals.
- A Crypto Finance report suggests Strategy’s recent Bitcoin sale had only a short-lived impact, highlighting the market’s resilience.
Bitcoin (BTC) falls below $64,000 on Tuesday, erasing part of the recent gains following six consecutive days of price rises. Institutional demand shows signs of recovery, with spot ETFs recording a second day of inflows through Monday after weeks of outflows. Reports suggest that Monday's headline about Strategy’s recent Bitcoin sale had only a short-lived impact on prices, highlighting the Crypto King’s resilience and deep liquidity.
Fragile US-Iran peace deal caps risk appetite
Tensions in the Strait of Hormuz remain high as Iran plans to introduce new service fees for ships passing through the strategically important waterway. Despite strong opposition from the US, Iran insists that the fees are for security, vessel supervision, and environmental protection, rather than tolls.
In addition, an oil tanker was struck by an unidentified projectile while transiting through the strait, complicating the fragile US-Iran peace deal and dampening the risk appetite, with Bitcoin dipping briefly below $63,000 on Tuesday.
Institutional demand revives
Institutional demand shows initial recovery signs after weeks of subdued activity. SoSoValue data show that spot BTC ETFs recorded an inflow of $265.69 million on Monday, marking the second day of inflows.
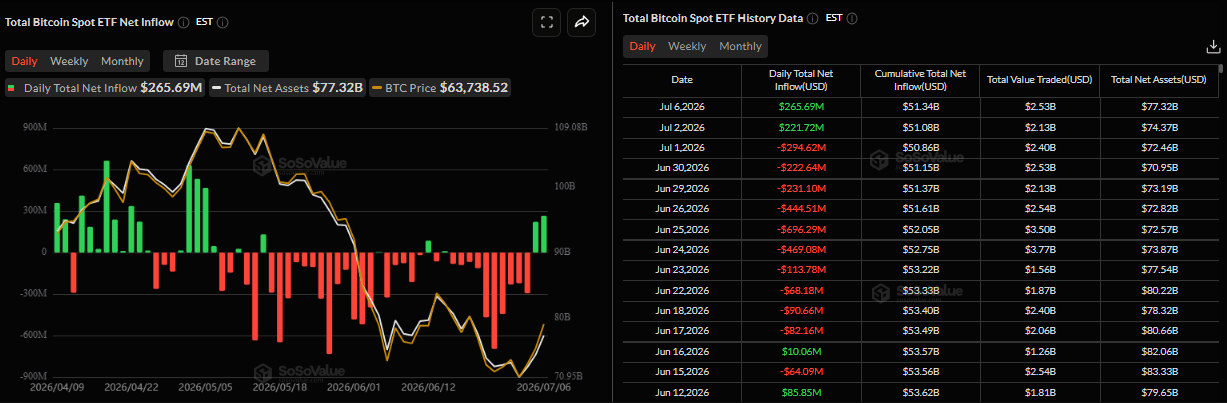
QCP Capital reported on Monday that the near-term backdrop for BTC appears constructive, particularly if spot BTC ETFs continue to see inflows after Friday’s inflows, which marked a welcome shift following more than a week of persistent outflows.
“A decisive reclaim of the $64,000 level this week would provide a further boost to market sentiment, while also helping to ease some of the recent uncertainty surrounding Strategy. For now, the bulls appear to have bought some extra time, but the final whistle is still some distance away,” the report added.
Strategy’s BTC sale sparks short-lived reaction
Strategy announced on Monday that it sold 3,588 BTC for $216 million to fund dividends on its Digital Credit. This news initially weighed on BTC, which corrected roughly 4%. However, the Crypto King recovered and closed Monday with mild gains, suggesting the selling pressure was largely absorbed.
Crypto Finance reported on Tuesday that transactions of this size are typically executed over-the-counter (OTC) and extensively hedged well before public disclosure. By the time the market receives the announcement, the underlying exposure has usually already been absorbed.
The report further explained that Bitcoin’s deep liquidity enables it to absorb sizeable transactions without causing significant market disruption, explaining the short-lived price correction.
Looking ahead, analysts believe the more important question is whether this sale is an isolated event or the start of a broader pattern. As Strategy continues issuing preferred shares and other yield-bearing instruments backed by its Bitcoin holdings, the company increasingly needs to generate cash to service dividends and other obligations.
“In that context, periodic Bitcoin sales may gradually become a feature of the structure rather than an exception,” the report added.
Despite these concerns, the analyst stressed that the sale does not signal a shift in Strategy’s long-term conviction on Bitcoin.
“Since the dividend burden attached to these instruments represents only a fraction of the underlying Bitcoin holdings, only a relatively small portion of the position needs to be monetized. In that regard, the market’s ability to absorb the recent sale relatively easily may ultimately be viewed as constructive,” concluded the report.
In an exclusive interview, Jake Kennis, Senior Research Analyst at Nansen, said: “The bigger takeaway is less about Michael Saylor specifically, or how much more Strategy may eventually sell, and more about how the market reacted once selling actually began.”
Kennis continued that BTC has already fallen sharply this year and is now many months into a bear market, with prices down around 50% from the highs. The fear of Strategy becoming a seller likely contributed to weakness, but the actual reported sale appears to have had a more limited impact than many expected. Selling into the $60,000 area while BTC continues to hold that level is notable and may slightly favor a less bearish interpretation of the near-term market structure.
Bitcoin Price Forecast: BTC faces rejection at $64,000 resistance zone
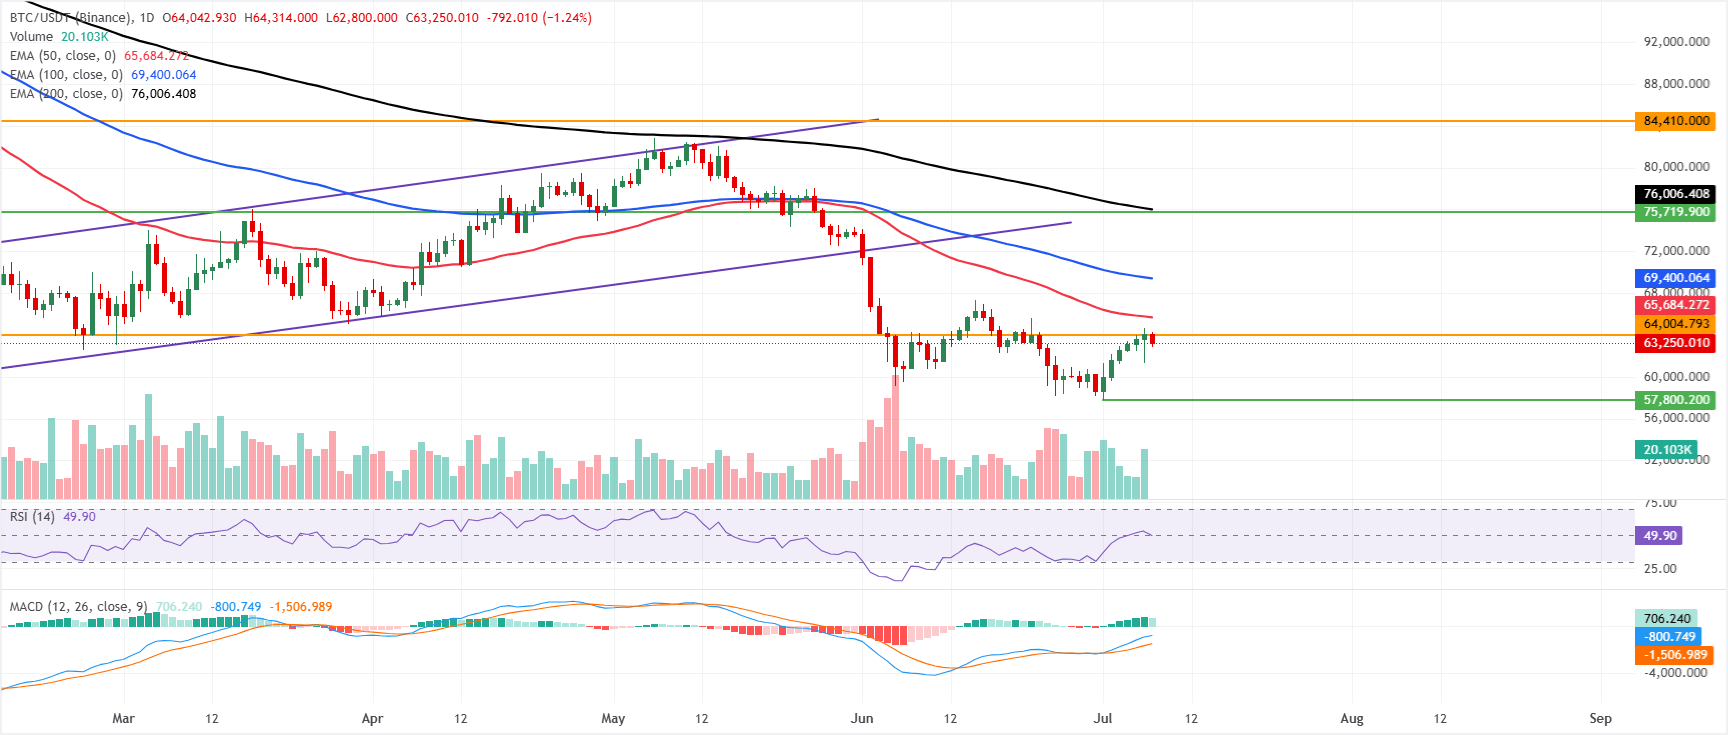
Bitcoin price trades at $63,250 on Tuesday, maintaining a bearish near-term bias as it remains below the 50-day, 100-day, and 200-day Exponential Moving Averages (EMAs) at $65,684, $69,400, and $76,006, respectively.
The Relative Strength Index (RSI) hovering around 50 suggests neutral momentum, while the Moving Average Convergence Divergence (MACD) remains in positive territory, with a rising line and an expanding histogram. Both indicators hint that downside pressure may be losing intensity rather than accelerating.
On the topside, initial resistance is seen at the horizontal line around $64,000, followed by the 50-day EMA at $65,684, with the 100-day EMA at $69,400 and the 200-day EMA at $76,006 reinforcing a broader supply band ahead of the major barrier at $84,410.
On the downside, the absence of clearly defined nearby supports in the provided data suggests that any renewed selling below $63,000 would extend the correction toward the yearly low of $57,800 seen on July 1.
(The technical analysis of this story was written with the help of an AI tool. Know more.)
Bitcoin, altcoins, stablecoins FAQs
Bitcoin is the largest cryptocurrency by market capitalization, a virtual currency designed to serve as money. This form of payment cannot be controlled by any one person, group, or entity, which eliminates the need for third-party participation during financial transactions.
Altcoins are any cryptocurrency apart from Bitcoin, but some also regard Ethereum as a non-altcoin because it is from these two cryptocurrencies that forking happens. If this is true, then Litecoin is the first altcoin, forked from the Bitcoin protocol and, therefore, an “improved” version of it.
Stablecoins are cryptocurrencies designed to have a stable price, with their value backed by a reserve of the asset it represents. To achieve this, the value of any one stablecoin is pegged to a commodity or financial instrument, such as the US Dollar (USD), with its supply regulated by an algorithm or demand. The main goal of stablecoins is to provide an on/off-ramp for investors willing to trade and invest in cryptocurrencies. Stablecoins also allow investors to store value since cryptocurrencies, in general, are subject to volatility.
Bitcoin dominance is the ratio of Bitcoin's market capitalization to the total market capitalization of all cryptocurrencies combined. It provides a clear picture of Bitcoin’s interest among investors. A high BTC dominance typically happens before and during a bull run, in which investors resort to investing in relatively stable and high market capitalization cryptocurrency like Bitcoin. A drop in BTC dominance usually means that investors are moving their capital and/or profits to altcoins in a quest for higher returns, which usually triggers an explosion of altcoin rallies.
Recommended Articles


