


Gold Price Forecast: Trump’s Tough Stance and Hawkish Fed Minutes May Push Gold Below $4,000.
TradingKey - As of the Asian session on July 9, after falling for three consecutive trading days, gold prices ( XAUUSD) remained in a volatile and weak trend today around $4,060. From a technical perspective, gold prices are under pressure due to the worsening situation between the US and Iran, a stronger US dollar, and the hawkish tilt of the Federal Reserve minutes.
Why are gold prices falling?
From a fundamental perspective, there are two core variables influencing gold price movements today: first, the flare-up in U.S.-Iran tensions, and second, the latest Federal Reserve meeting minutes showing growing policy division but an overall hawkish stance.
Regarding the U.S.-Iran situation, the latest news indicates that Trump's statements on Iran at the NATO summit were visibly hawkish. He remarked that the U.S.-Iran ceasefire might be over and hinted that the U.S. military could continue taking action against Iran. Trump also warned Iran of a stronger U.S. response should it continue to attack commercial vessels near the Strait of Hormuz.
Following the news, oil prices surged, with WTI ( USOIL) crude oil prices rising by more than 5% at their peak during the day, and Brent crude rising over 6%, briefly breaking above the $80 mark during the session. With the sharp rebound in oil prices, market concerns over U.S. inflationary pressures flared up again. If oil prices continue to rise, the cooling process of U.S. inflation could be disrupted, making it even harder for the Fed to signal monetary easing, which would in turn exert heavy pressure on gold prices.
Meanwhile, the Federal Reserve's newly released June interest rate meeting minutes further weighed on gold. The minutes showed that Fed officials have clear disagreements regarding the future path of inflation. Some officials believe inflation could recede as the impacts of oil prices and tariffs gradually fade. However, many other officials worry that rising costs of semiconductors, tech equipment, and electricity driven by AI infrastructure investment could keep inflation sticky. More importantly, some officials believed there was a case for raising interest rates at the June meeting, although the Fed ultimately decided unanimously to keep rates unchanged.
Previously, the cooling U.S. June employment data had lowered the probability of an immediate rate hike in July, but the meeting minutes showed a significant split over whether further rate hikes are still needed this year. For gold, as long as the Fed does not explicitly rule out the option of hiking rates, the US dollar and Treasury yields will remain supported, and the upside for gold prices will be capped.
Gold Price Analysis: Short-Term Fall Below $4,000 Possible
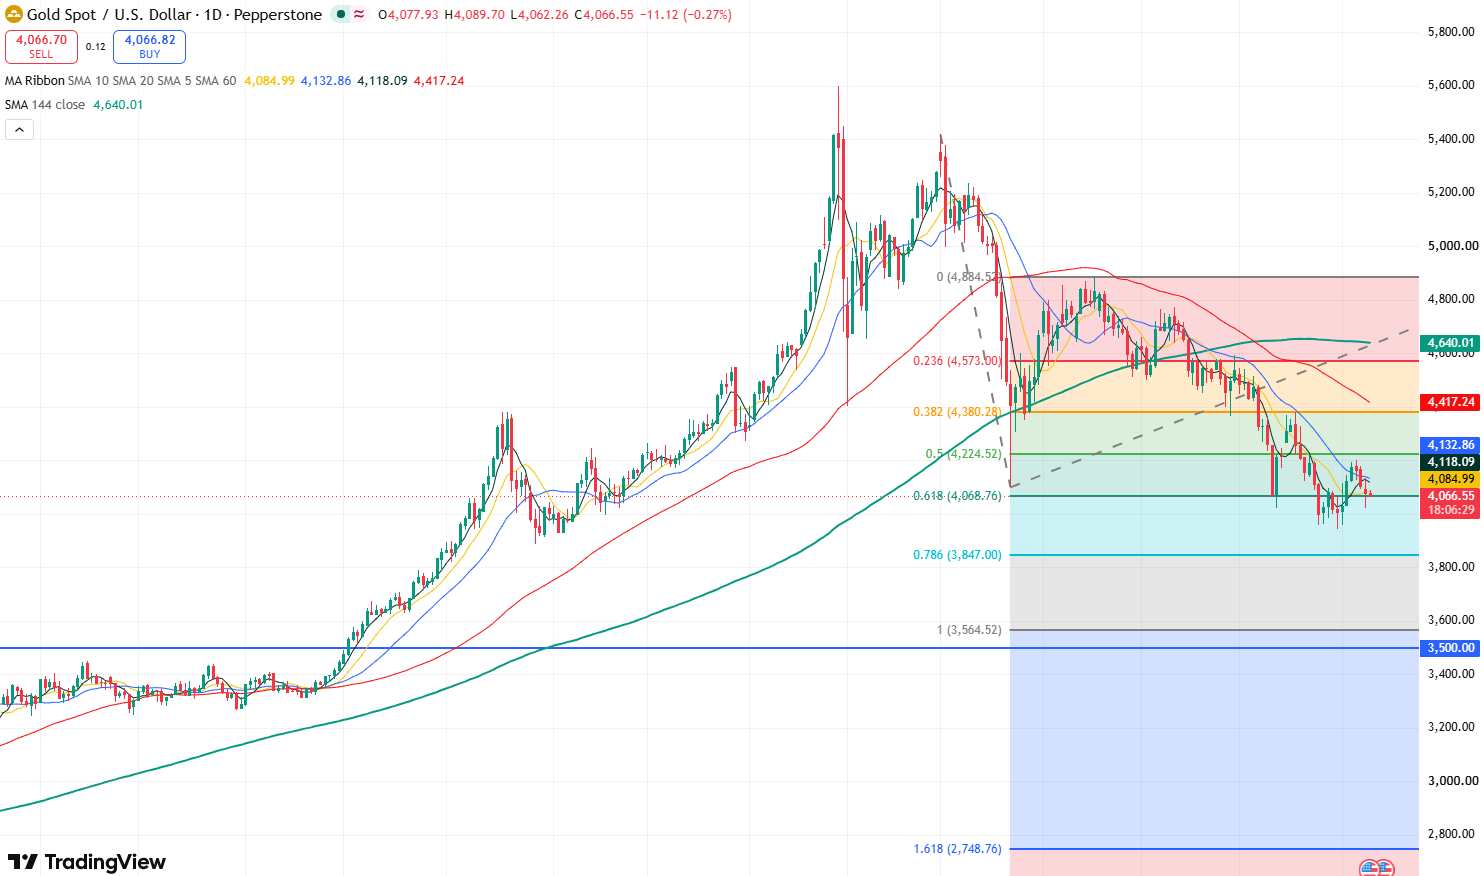
Gold price daily chart. Source: TradingView
Looking at the daily chart of gold, after rebounding to near the resistance level of $4,200, the gold price has fallen for three consecutive trading days. As the gold price dropped below $4,100, the momentum of gold bears has been further strengthened. At the same time, driven by the worsening situation between the US and Iran, bearish sentiment in the market has been further amplified, and the gold price may continue to correct in the short term.
At present, the primary support level below the gold price is around $4,020. If it falls below this level, the gold price may further test the $4,000 mark downward. If the downward trend continues, the gold price may test the support level of $3,900.
However, it is worth noting that although the gold price fell below the support level of $4,070 during yesterday's session, the closing price still stood firm above $4,070, indicating that this level still has a certain degree of support. Investors need to watch whether today's closing price will continue to stand firm above $4,070. If today's closing price is higher than $4,070, the gold price may usher in a technical rebound in the short term, first testing the resistance level of $4,100 upward, and further up to $4,200.
Recommended Articles


