


Solana (SOLUSD) Is up 1.06% on Jul 9: What Do On-Chain Data and Market Sentiment Show?
Solana (SOLUSD) is up 1.06% at Jul 9 01:00(ET), now at $76.98, with a 7-day down of 3.81%.
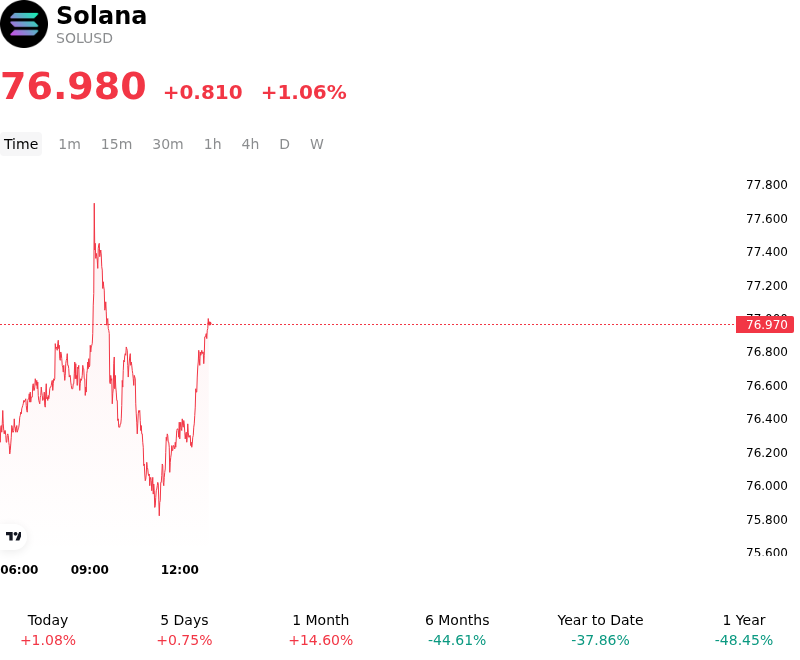
What is driving Solana (SOLUSD)’s stock price up today?
The Solana network is experiencing a significant increase in on-chain transaction volume, user engagement, and network throughput, which has bolstered long-term adoption expectations. The network's active addresses are testing yearly highs, and transaction processing speeds are trending sharply higher on a seven-day average. This momentum has been further supported by substantial real-world asset integration, including Mastercard expanding its stablecoin settlement capabilities to the Solana blockchain, which connects the network to a massive global payment infrastructure. Additionally, Solana’s institutional narrative has been reinforced by the expansion of tokenized fund listings, high-speed exchange tools, and the total value of tokenized real-world assets on the network crossing key milestones.
However, the broader market environment remains heavily constrained by macroeconomic headwinds and restrictive global monetary policy expectations. Global digital assets are facing downward pressure following the release of the Federal Reserve’s June meeting minutes, which revealed a deeply divided central bank. Although the Fed ultimately voted to hold interest rates steady, the internal minutes displayed a far more hawkish undertone than previous public remarks, with nearly half of the committee members signaling the potential necessity for another interest rate hike. This hawkish shift, alongside elevated inflation forecasts tied to technological infrastructure spending and geopolitical tensions, has reduced overall market liquidity and dampened global risk appetite.
Geopolitical developments in the Middle East have further triggered waves of risk aversion, driving capital toward safe-haven assets and putting immediate pressure on high-beta digital assets. Despite the robust underlying network metrics and growing institutional interest in Solana-based financial products, these macroeconomic pressures are keeping a lid on sustained upward momentum. Long-term investors are closely monitoring these macro-driven liquidity conditions, as well as upcoming inflation data, to determine whether network-specific fundamentals can decouple from the broader market's cautious sentiment.
Technical Analysis of Solana (SOLUSD)
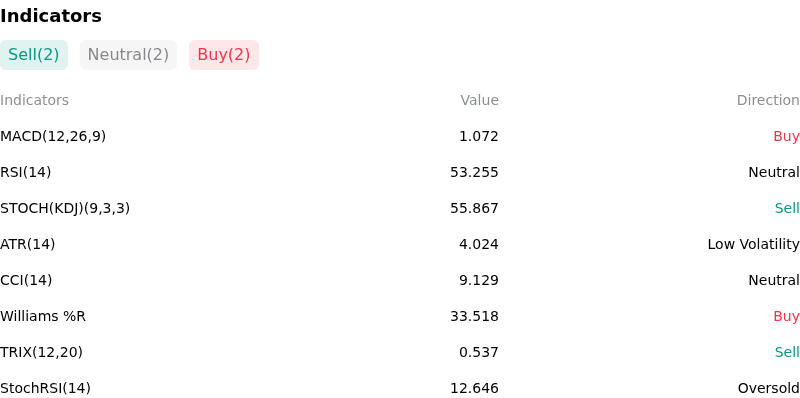
Technically, Solana (SOLUSD) shows a MACD (12,26,9) value of 1.072, indicating a buy signal. The RSI at 53.255 suggests neutral condition and the Williams %R at 33.518 suggests buy condition. Please monitor closely.
More details about Solana (SOLUSD)
Recent Events and Risks:
- Rejection Near Technical Resistance and Squeeze Risk: After a short-term recovery, SOL encountered strong technical rejection in the $80 to $85 zone. With derivatives markets heavily skewed toward leveraged longs—including a single whale's highly leveraged 20x long position worth over $18.81 million—any sustained drop below $80 risks triggering cascading liquidations from tightly clustered leverage pockets down to $77 and lower.
- Spot ETF Capital Outflows: Following a brief period of institutional accumulation, U.S.-listed spot Solana ETFs reversed direction on July 8, recording net outflows of $8.6 million. This capital flight signals emerging caution and profit-taking among institutional investors, threatening to dry up the bid support that had previously kept SOL stable against broader market weakness.
- Ecosystem Token Unlock Dilution: The Solana network is facing structural, ecosystem-wide sell pressure throughout July. A total of 14 Solana-based projects are releasing tokens, led by a massive $123.65 million unlock for the PUMP token scheduled for July 12, which threatens to drain local capital and divert liquidity away from the native SOL token.
- Staked Supply Reduction and Long-Term Supply Overhang: On-chain data indicates that the total staked SOL supply has hit multi-month lows, suggesting that large-scale validators and long-term holders are unstaking their tokens to position for potential market exits. This structural weakness is compounded by the persistent, systemic threat of spot market distribution from the bankrupt FTX estate's remaining locked assets.
Recommended Articles


