


USD/CHF Price Forecast: Trendline break puts 50-day SMA in focus
- USD/CHF slips below trendline as short-term momentum turns bearish.
- 50-day SMA near 0.8042 becomes immediate downside support.
- Bulls need 0.8100 reclaimed to refocus 0.8150 and 0.8200.
The USD/CHF retraced on Tuesday, down 0.16%, as the US Dollar weakened amid improved risk appetite, driven by renewed hopes of a US-Israel peace deal to open the Strait of Hormuz. The pair trades below 0.8100.
USD/CHF Price Forecast: Technical outlook
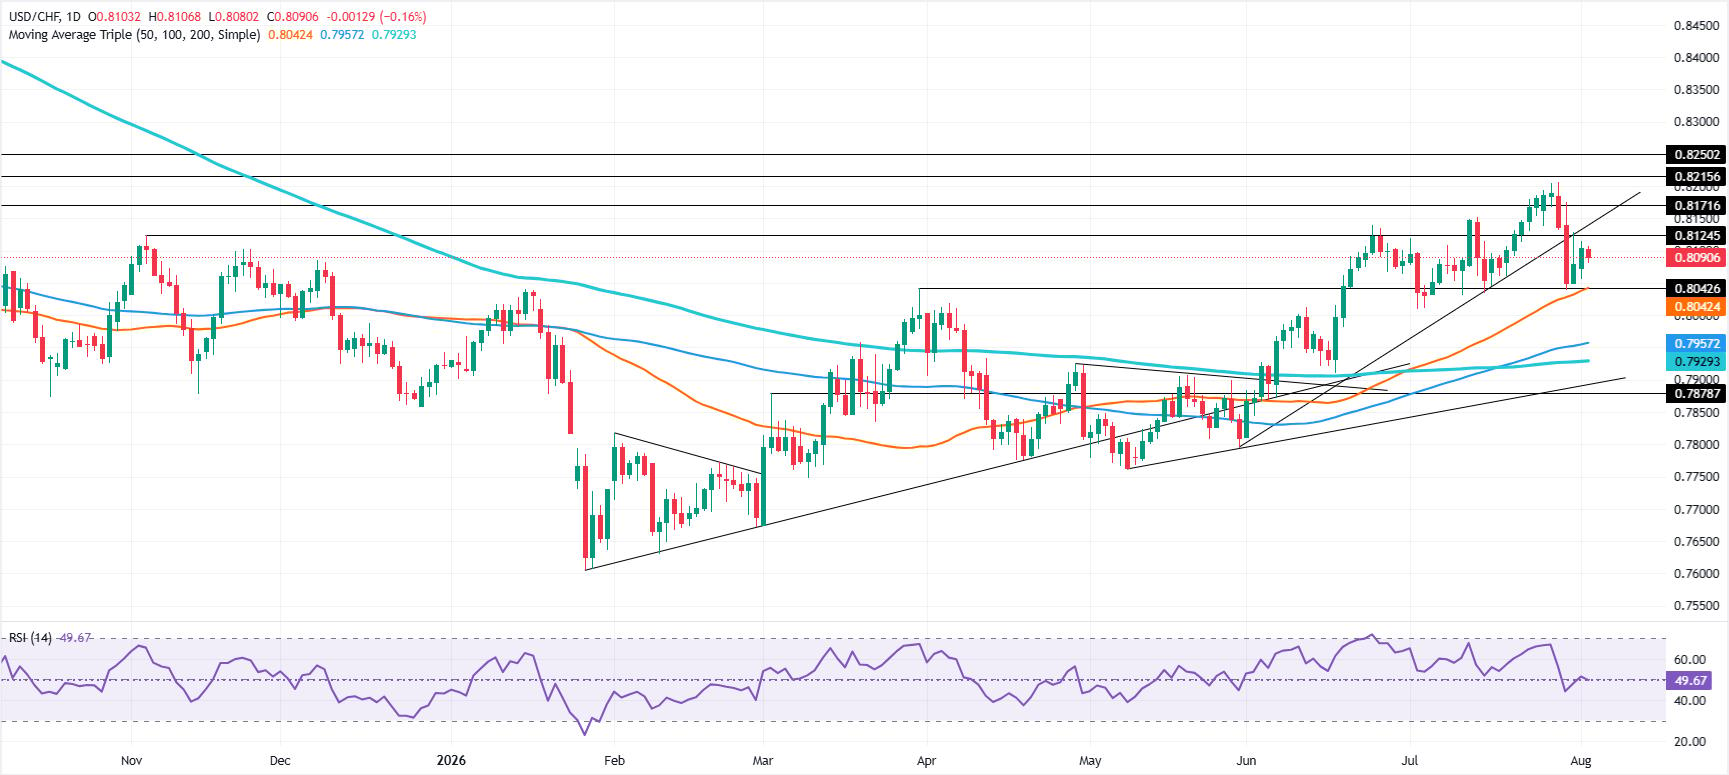
After falling below a support trendline connecting the lows of June and mid-July, the USD/CHF turned bearish in the short-term, with the next key support seen at the 50-day Simple Moving Average (SMA) at 0.8042. This is further confirmed by the Relative Strength Index (RSI), which turned bearish.
Despite this, the overall market structure remains constructive, having registered a series of successive higher highs and higher lows, indicating that the uptrend remains intact.
For USD/CHF to turn bearish, it needs to clear the 50-day SMA, then the 0.8000 mark. Below is the 100-day SMA at 0.7957, immediately followed by the 200-day SMA at 0.7929. On further weakness, the next stop would be the 0.7900 figure.
To continue bullish momentum, USD/CHF must reclaim 0.8100 and break through 0.8150. Once above, it faces the 0.8200 level, then the yearly high at 0.8207. Beyond that, key resistance points are the psychological thresholds at 0.8250 and 0.8300.
USD/CHF Price Chart – Daily
Swiss Franc Price Today
The table below shows the percentage change of Swiss Franc (CHF) against listed major currencies today. Swiss Franc was the strongest against the Japanese Yen.
| USD | EUR | GBP | JPY | CAD | AUD | NZD | CHF | |
|---|---|---|---|---|---|---|---|---|
| USD | -0.19% | -0.11% | 0.36% | 0.13% | -0.65% | -0.37% | -0.17% | |
| EUR | 0.19% | 0.06% | 0.58% | 0.32% | -0.48% | -0.20% | 0.03% | |
| GBP | 0.11% | -0.06% | 0.51% | 0.26% | -0.53% | -0.26% | -0.03% | |
| JPY | -0.36% | -0.58% | -0.51% | -0.24% | -1.02% | -0.77% | -0.43% | |
| CAD | -0.13% | -0.32% | -0.26% | 0.24% | -0.78% | -0.52% | -0.29% | |
| AUD | 0.65% | 0.48% | 0.53% | 1.02% | 0.78% | 0.26% | 0.49% | |
| NZD | 0.37% | 0.20% | 0.26% | 0.77% | 0.52% | -0.26% | 0.24% | |
| CHF | 0.17% | -0.03% | 0.03% | 0.43% | 0.29% | -0.49% | -0.24% |
The heat map shows percentage changes of major currencies against each other. The base currency is picked from the left column, while the quote currency is picked from the top row. For example, if you pick the Swiss Franc from the left column and move along the horizontal line to the US Dollar, the percentage change displayed in the box will represent CHF (base)/USD (quote).
Recommended Articles


