


The Euro finally gets cheaper energy, and that is the problem
- EUR/USD trades just under 1.1400 after a third straight session of falling Crude Oil, a terms-of-trade gift the currency has not been paid for.
- A hawkish hold last week left markets pricing a September hike from the European Central Bank, and the single currency still sits within a cent of its summer low.
- The hawkish case in Frankfurt runs on energy, the hawkish case in Washington does not, and the peace trade quietly removes only one of them.
The Euro trades just under 1.1400 on Tuesday, around 0.15% firmer, after a session that ran from a shade above 1.1350 to a fraction over 1.1400. Behind that half-cent range sits a third consecutive session of falling Crude Oil, with Brent near $84.00 and West Texas Intermediate near $79.00 as the American and Iranian stand-down runs into a fourth day.
For the developed world's largest net energy importer, roughly 16% off last Thursday's peak is the cleanest fundamental improvement on offer, and it has bought this currency a sixth of a cent. That failure is not a market oversight. It is the correct reading of what falling energy actually does to the rate differential.
Cheaper energy is a rate cut in disguise
The European Central Bank held its deposit rate at 2.25% last week and framed the hold hawkishly enough to move markets toward a quarter-point hike in September. Every part of that stance is energy-derived. Euro-area inflation ran at 2.8% YoY in June against 3.2% in May, and staff projections put the 2026 average near 3.0% almost entirely on the energy line.
Strip out the war premium and the projection falls with it, which takes the September hike along for the ride. A single currency whose only bid this year has been imported inflation cannot celebrate the removal of imported inflation. The terms-of-trade gain and the rate-differential loss arrive in the same headline, and the second one is larger.
The American case does not run on Crude Oil
Nothing symmetrical happens on the other side of the pair. Rate futures put a July hike at just over 30%, trimmed from just under 36% at the weekend, while cumulative odds of at least one hike by December hold above 91% and two or more sit near 58%. The front end gave money back and the terminal hardened anyway.
That resilience is structural. The Federal Reserve's inflation problem is import prices running above 7% YoY, a tariff schedule still being extended, and a passthrough chain into food and materials that operates on planting-season lags rather than on pump prices. Peace in the Strait of Hormuz does not touch any of it, so the same headline that disarms one central bank leaves the other exactly where it was.
The growth arithmetic compounds the problem. Euro-area output is tracked near 0.8% for 2026 against an American economy running second-quarter growth around 2.1% annualized, so the capital-flow argument and the rate argument point in the same direction. A currency needs one of those two to break its way before a range floor becomes a base rather than a waypoint.
Five weeks in a box for a reason
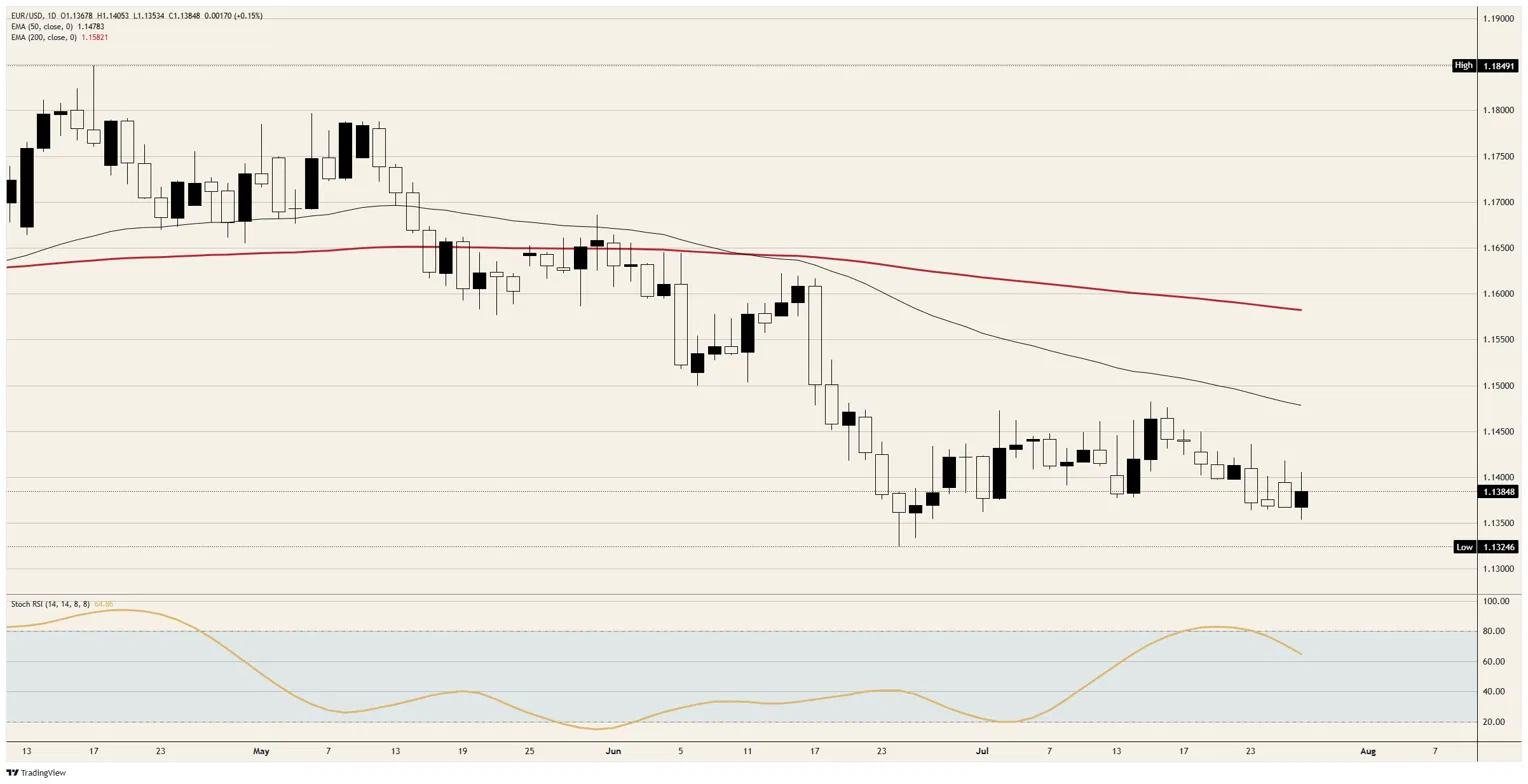
The pair has now spent five weeks between roughly 1.1325 and 1.1450, with the 50-day Exponential Moving Average just under 1.1500 and the 200-day near 1.1600, both declining and the faster line beneath the slower since mid-June. Tuesday's Asian equity shock, with Korea's benchmark down close to 11%, produced no meaningful bid either, which is its own verdict on the currency's defensive credentials.
The Dollar Index near a five-week high with energy falling and equities cracking is not a contradiction. It is a market that has decided the American terminal rate outranks every other variable, and the Euro is on the wrong side of that trade until something changes the December strip.
Positioning explains the durability of the box. September pricing gives the downside a floor while the American terminal caps the upside, a stable arrangement right up to the moment one of the two assumptions gets tested. Wednesday tests the American one. The July flash inflation estimates test the European one on Friday, which makes this the first week since June in which the range genuinely has an expiry date.
The week ahead
Wednesday's Federal Open Market Committee decision at 18:00 GMT, with the press conference at 18:30 GMT and no Summary of Economic Projections attached, is the pair's pivot. Thursday at 12:30 GMT brings June core Personal Consumption Expenditures at 0.2% MoM and 3.3% YoY against 3.4% previously, second-quarter Gross Domestic Product at 2.1% annualized, and initial jobless claims at 200K after a 187K print.
Friday adds the second-quarter Employment Cost Index at 0.8% and the final University of Michigan survey, with one-year inflation expectations at 4.2%. Euro-area second-quarter growth and the July flash inflation estimates also land later in the week, and on current form they will matter to this exchange rate considerably less than the American docket does.
Technical outlook
Resistance: 1.1400 is the immediate line and Tuesday's ceiling, with the five-week range top near 1.1450 above it. The 50-day Exponential Moving Average just under 1.1500 is the first level that would change the structure, and it has not been touched since mid-June.
Support: 1.1350 is the floor of the recent congestion, with the late-June low a shade above 1.1300 beneath it. A break there opens 1.1250 with no meaningful shelf until 1.1200.
Bias: Bearish. The daily Stochastic Relative Strength Index near 65 and rolling over is the only near-term positive, and it is not enough against price beneath two declining moving averages with the faster one below the slower. Sell rallies into 1.1450. Invalidation is a daily close above 1.1500.
EUR/USD daily chart
Euro FAQs
The Euro is the currency for the 20 European Union countries that belong to the Eurozone. It is the second most heavily traded currency in the world behind the US Dollar. In 2022, it accounted for 31% of all foreign exchange transactions, with an average daily turnover of over $2.2 trillion a day. EUR/USD is the most heavily traded currency pair in the world, accounting for an estimated 30% off all transactions, followed by EUR/JPY (4%), EUR/GBP (3%) and EUR/AUD (2%).
The European Central Bank (ECB) in Frankfurt, Germany, is the reserve bank for the Eurozone. The ECB sets interest rates and manages monetary policy. The ECB’s primary mandate is to maintain price stability, which means either controlling inflation or stimulating growth. Its primary tool is the raising or lowering of interest rates. Relatively high interest rates – or the expectation of higher rates – will usually benefit the Euro and vice versa. The ECB Governing Council makes monetary policy decisions at meetings held eight times a year. Decisions are made by heads of the Eurozone national banks and six permanent members, including the President of the ECB, Christine Lagarde.
Eurozone inflation data, measured by the Harmonized Index of Consumer Prices (HICP), is an important econometric for the Euro. If inflation rises more than expected, especially if above the ECB’s 2% target, it obliges the ECB to raise interest rates to bring it back under control. Relatively high interest rates compared to its counterparts will usually benefit the Euro, as it makes the region more attractive as a place for global investors to park their money.
Data releases gauge the health of the economy and can impact on the Euro. Indicators such as GDP, Manufacturing and Services PMIs, employment, and consumer sentiment surveys can all influence the direction of the single currency. A strong economy is good for the Euro. Not only does it attract more foreign investment but it may encourage the ECB to put up interest rates, which will directly strengthen the Euro. Otherwise, if economic data is weak, the Euro is likely to fall. Economic data for the four largest economies in the euro area (Germany, France, Italy and Spain) are especially significant, as they account for 75% of the Eurozone’s economy.
Another significant data release for the Euro is the Trade Balance. This indicator measures the difference between what a country earns from its exports and what it spends on imports over a given period. If a country produces highly sought after exports then its currency will gain in value purely from the extra demand created from foreign buyers seeking to purchase these goods. Therefore, a positive net Trade Balance strengthens a currency and vice versa for a negative balance.
Recommended Articles


