


Australian Dollar holds as PBOC stands firm
- AUD/USD consolidates around 0.7000 after recovering sharply on the 4-hour chart.
- The PBOC maintained its one-year and five-year Loan Prime Rates at 3.00% and 3.50%, respectively.
- Investors await the US ADP Employment Change four-week average after the previous 19.75K reading.
AUD/USD trades around the 0.7000 area on Monday, holding near recent highs after recovering from last week’s decline. The Australian Dollar (AUD) remains supported by limited US Dollar (USD) demand, although rising geopolitical risks and slightly higher US Treasury yields are restricting the pair’s upside.
In China, the People’s Bank of China (PBOC) left its benchmark lending rates unchanged for a fourteenth consecutive month. The one-year Loan Prime Rate, which influences most corporate and household loans, remained at 3.00%, while the five-year rate, commonly used to price mortgages, was maintained at 3.50%. The expected decision had a limited immediate impact on the Aussie, while the absence of additional monetary stimulus highlighted concerns about China’s uneven economic recovery.
On the United States (US) side, Treasury yields ticked higher, offering some support to the Greenback. However, the softer inflation outlook has helped cool expectations of aggressive Federal Reserve (Fed) interest rate increases, limiting the US Dollar’s recovery. Bond strategists continue to expect shorter-term yields to ease as markets reduce their rate hike bets.
Geopolitical uncertainty is also keeping investors cautious as the United States and Iran widen their attacks. Recent strikes have targeted military and civilian infrastructure, while attacks involving tankers and desalination facilities have increased concerns about Gulf shipping routes, regional water supplies and further energy-market disruptions. The risk-off environment could increase safe-haven demand for the USD and limit gains in risk-sensitive currencies such as the Australian Dollar.
Looking ahead, investors will monitor Tuesday’s US ADP Employment Change four-week average. The previous release showed that private employers added an average of 19.75K jobs per week in the four weeks ending June 27, down from 21K previously. A further slowdown could reinforce signs of cooling hiring momentum and weigh on the Greenback, while a stronger figure could support US yields and place renewed pressure on AUD/USD.
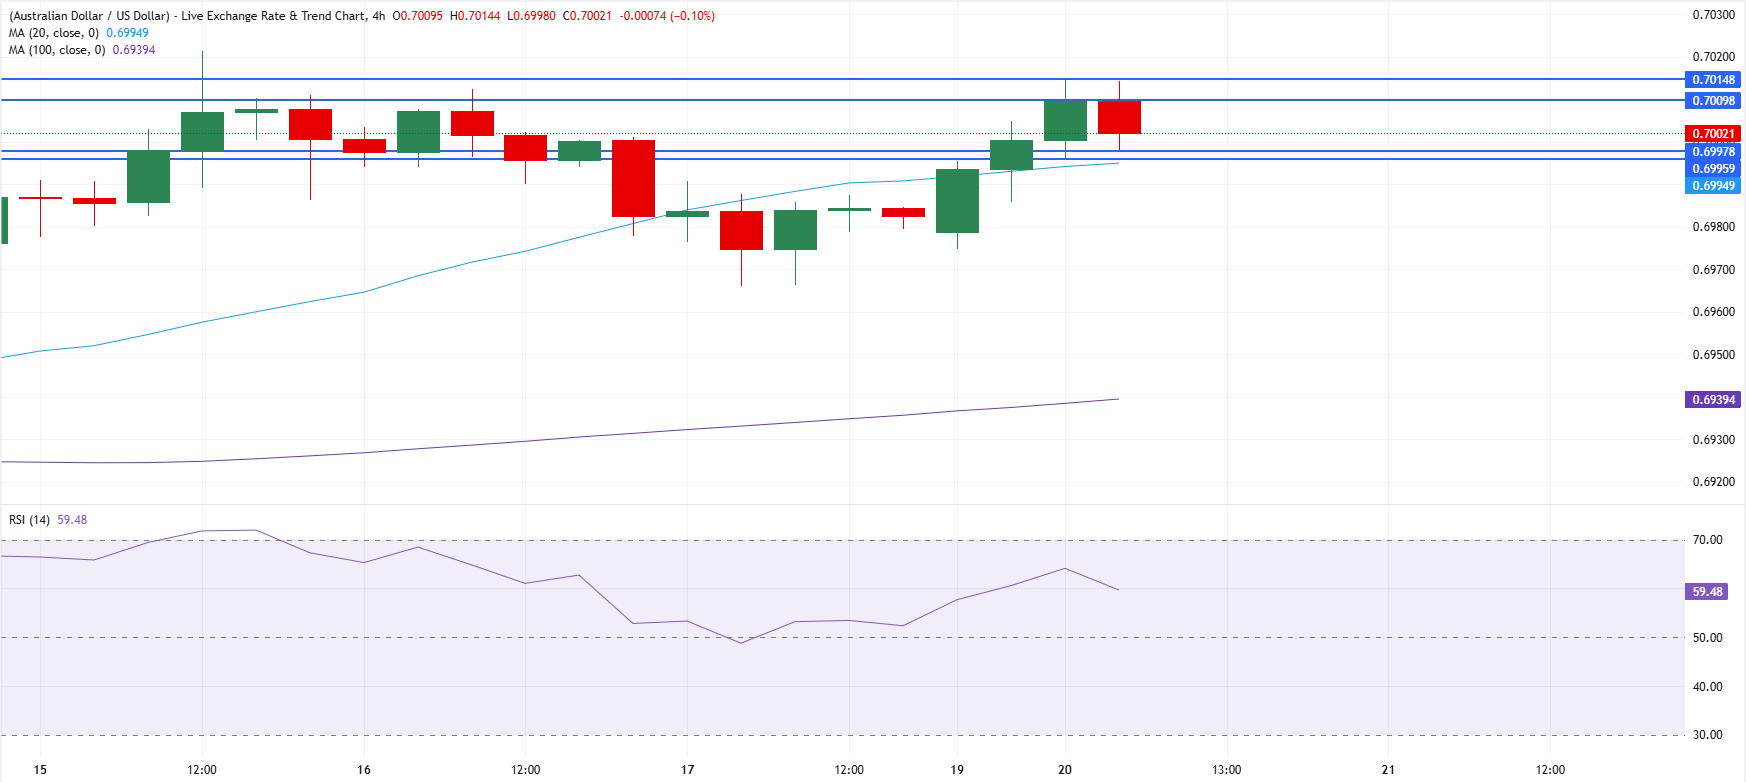
Short-term technical analysis:
On the 4-hour chart, AUD/USD trades at 0.7002, holding a modest bullish bias as it consolidates above the 20-period Simple Moving Average (SMA) at 0.6995 and the 100-period SMA at 0.6939. The clustering of price over these averages suggests underlying demand remains intact, while the Relative Strength Index (RSI) around 59 indicates positive but not overstretched momentum, hinting that dips may continue to attract buyers in the near term.
On the topside, immediate resistance emerges at 0.7010, with a stronger cap just above at 0.7015, where a break would open the door to a more decisive advance. On the downside, initial support is seen at 0.6998, followed by 0.6996, with the 20-period SMA at 0.6995 reinforcing this nearby floor; a deeper pullback toward the 100-period SMA at 0.6939 would likely meet firmer medium-term demand.
(The technical analysis of this story was written with the help of an AI tool. Know more.)
Recommended Articles


