


Natural Gas (NATGAS) Is up 2.01% on Jul 21: What Changed in Supply and Demand?
Natural Gas (NATGAS) is up 2.01% at Jul 21 01:15(ET), now at $2.842, with a 7-day down of 0.56%.
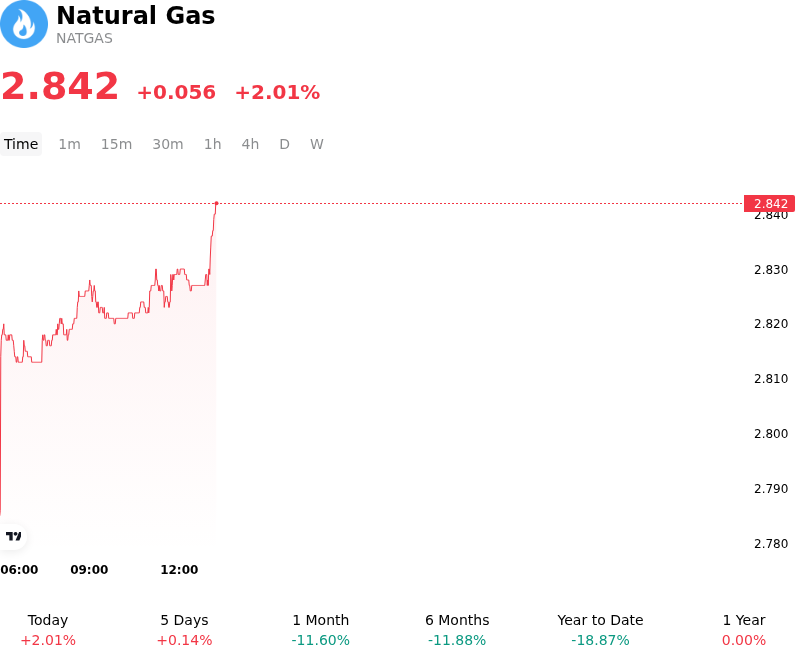
What is driving Natural Gas (NATGAS)’s stock price up today?
The upward pressure on natural gas prices is primarily driven by a significant shift in medium-range weather forecasts, which now indicate a sustained period of above-normal temperatures across the key consuming regions of the Southern and Eastern United States. As cooling degree days are projected to trend well above seasonal averages for the remainder of July, power burn demand is expected to reach near-record levels. This surge in electricity generation requirement for air conditioning is tightening the immediate supply-demand balance, forcing market participants to re-evaluate the adequacy of current storage injection rates.
Supplementing the weather-driven demand is a recovery in feedgas deliveries to major liquefied natural gas export terminals. Following a period of scheduled maintenance at several Gulf Coast facilities, the return to full operational capacity has increased the call on domestic production. This structural demand for exports remains a critical floor for prices, particularly as European and Asian buyers continue to seek cargoes to replenish their own inventories ahead of the winter heating season. The competition between domestic power generation and export commitments is creating a supply squeeze that is reflected in the current price appreciation.
On the supply side, domestic production has shown signs of plateauing. Recent data suggests that output from the Appalachian and Haynesville basins has stabilized rather than increased, as producers maintain capital discipline despite the seasonal uptick in prices. With production growth failing to keep pace with the accelerated demand from the power sector, the anticipated surplus in inventories is being eroded faster than earlier consensus estimates suggested. Institutional investors are closely monitoring the upcoming storage reports, expecting a smaller-than-average injection that would further narrow the surplus relative to the five-year mean.
From a technical and positioning perspective, the price move is being amplified by short-covering activity among hedge funds and large speculators. Having held significant net-short positions earlier in the shoulder season, many institutional players are now forced to neutralize their exposure as the fundamental outlook shifts toward a tighter market balance. This technical momentum, combined with the fundamental drivers of heat-driven demand and robust export flows, suggests that the market is transitioning from a period of seasonal oversupply to one defined by tightening margins and increased sensitivity to weather disruptions.
Technical Analysis of Natural Gas (NATGAS)
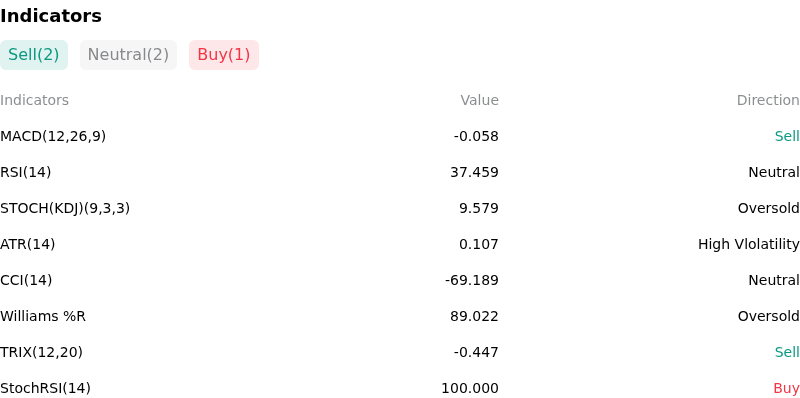
Technically, Natural Gas (NATGAS) shows a MACD (12,26,9) value of -0.058, indicating a sell signal. The RSI at 37.459 suggests neutral condition and the Williams %R at 89.022 suggests oversold condition. Please monitor closely.
More details about Natural Gas (NATGAS)
Recent Events and Risks:
- Bearish Weather Model Shifts: Recent updates to the Global Forecast System (GFS) and European (ECMWF) models indicate a transition toward unseasonably mild temperatures across the Lower 48 through early November, significantly suppressing residential and commercial heating degree days (HDDs) and eroding seasonal demand expectations.
- Persistent Storage Surplus: Market sentiment is pressured by recent storage data confirming that U.S. inventories remain nearly 5% above the five-year historical average, raising the risk of storage capacity constraints if the heating season start is delayed further.
- High Production Resilience: Despite low spot prices, domestic dry gas production has remained stubbornly high near 101-103 Bcf/d over the last 72 hours, as associated gas from robust Permian Basin oil activity continues to flood the market, preventing a meaningful supply-side rebalancing.
- LNG Export Intake Fluctuations: Intraday volatility has increased following reports of reduced feedgas flows to major Gulf Coast LNG export terminals due to scheduled maintenance and localized pipeline constraints, effectively trapping more supply within the domestic market and weighing on Henry Hub front-month valuations.
Recommended Articles


