


GBP/USD Price Forecast: Bounces back to near 1.3400 as US Dollar turns upside down
- GBP/USD rebounds to near 1.3400 as the US Dollar gives back early gains and turns lower.
- Signs of easing US-Iran prolonged war fears have weakened the US Dollar.
- Investors await the US CPI data and the UK monthly GDP data.
The British Pound (GBP) recovers its early losses and flattens around 1.3400 against the US Dollar (USD) during the European trading session on Monday. The GBP/USD pair bounces back as the US Dollar surrenders its opening gains and turns negative amid hopes that renewed hostilities between the United States (US) and Iran won’t be prolonged.
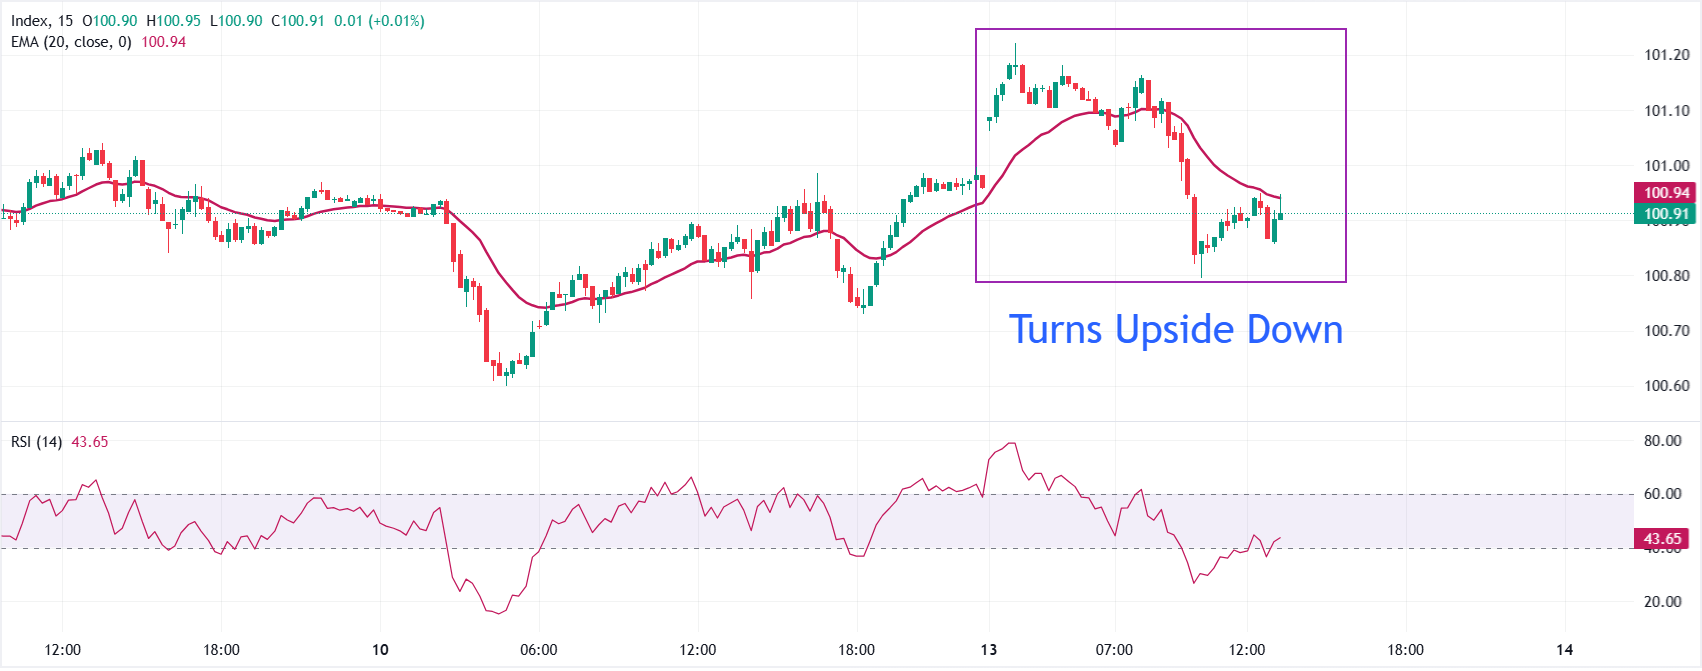
In the late European trade, the US Dollar Index (DXY), which gauges the Greenback’s value against six major currencies, trades 0.1% lower at around 100.85.
US Dollar Price Today
The table below shows the percentage change of US Dollar (USD) against listed major currencies today. US Dollar was the weakest against the New Zealand Dollar.
| USD | EUR | GBP | JPY | CAD | AUD | NZD | CHF | |
|---|---|---|---|---|---|---|---|---|
| USD | -0.10% | 0.09% | 0.26% | -0.16% | 0.14% | -0.34% | 0.07% | |
| EUR | 0.10% | 0.20% | 0.35% | -0.06% | 0.25% | -0.20% | 0.19% | |
| GBP | -0.09% | -0.20% | 0.17% | -0.25% | 0.08% | -0.38% | 0.04% | |
| JPY | -0.26% | -0.35% | -0.17% | -0.43% | -0.13% | -0.58% | -0.14% | |
| CAD | 0.16% | 0.06% | 0.25% | 0.43% | 0.31% | -0.12% | 0.29% | |
| AUD | -0.14% | -0.25% | -0.08% | 0.13% | -0.31% | -0.41% | 0.00% | |
| NZD | 0.34% | 0.20% | 0.38% | 0.58% | 0.12% | 0.41% | 0.43% | |
| CHF | -0.07% | -0.19% | -0.04% | 0.14% | -0.29% | -0.01% | -0.43% |
The heat map shows percentage changes of major currencies against each other. The base currency is picked from the left column, while the quote currency is picked from the top row. For example, if you pick the US Dollar from the left column and move along the horizontal line to the Japanese Yen, the percentage change displayed in the box will represent USD (base)/JPY (quote).
During the day, a spokesperson from the Iranian Foreign Ministry confirmed that efforts from Qatar, Oman and Pakistan to mediate tensions with the United States (US) are continuing, while accusing Washington of violating the memorandum of understanding (MoU) terms.
Meanwhile, military aggression between the US and Iran continues as Iran's Mehr News Agency stated during the European trade that several explosions were heard around Iran's Bandar Abbas and Qeshm island. However, the news has not been confirmed by major media outlets.
Going forward, investors will focus on the US Consumer Price Index (CPI) data for June and the United Kingdom (UK) monthly Gross Domestic Product (GDP) data for May, which are scheduled for Tuesday and Thursday, respectively.
GBP/USD technical analysis
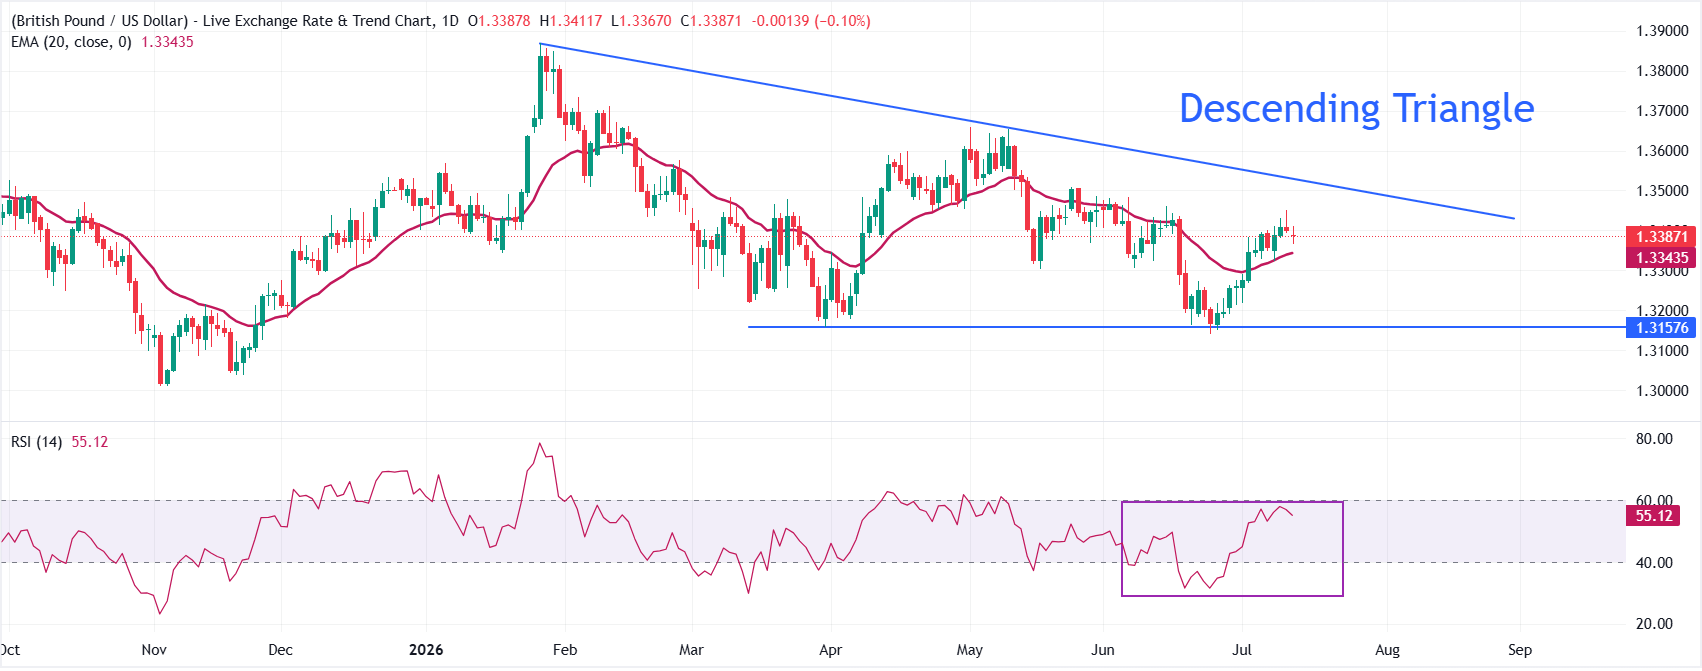
GBP/USD trades calmly near 1.3400. The pair holds a modest bullish bias as spot trades above the 20-day exponential moving average (EMA) at 1.3344, but the overall trend appears sideways amid the Descending Triangle formation.
The Relative Strength Index (RSI) at roughly 55 leans to the topside but remains shy of overbought territory, hinting at constructive yet not overstretched momentum.
On the topside, initial resistance emerges at the downward resistance trend line break price near 1.3528, and a daily close above this barrier would open the way for a more sustained advance. On the downside, immediate support is provided by the 20-day EMA at 1.3344, and a drop back below this moving average would ease the current bullish tone and expose deeper pullbacks toward the June 30 low at 1.3212.
(The technical analysis of this story was written with the help of an AI tool. Know more.)
Economic Indicator
Gross Domestic Product (MoM)
The Gross Domestic Product (GDP), released by the Office for National Statistics on a monthly and quarterly basis, is a measure of the total value of all goods and services produced in the UK during a given period. The GDP is considered as the main measure of UK economic activity. The MoM reading compares economic activity in the reference month to the previous month. Generally, a rise in this indicator is bullish for the Pound Sterling (GBP), while a low reading is seen as bearish.
Read more.Next release: Thu Jul 16, 2026 06:00
Frequency: Monthly
Consensus: 0.1%
Previous: -0.1%
Source: Office for National Statistics
Recommended Articles


