


British Pound Sterling stages a jailbreak while Westminster arranges a coronation
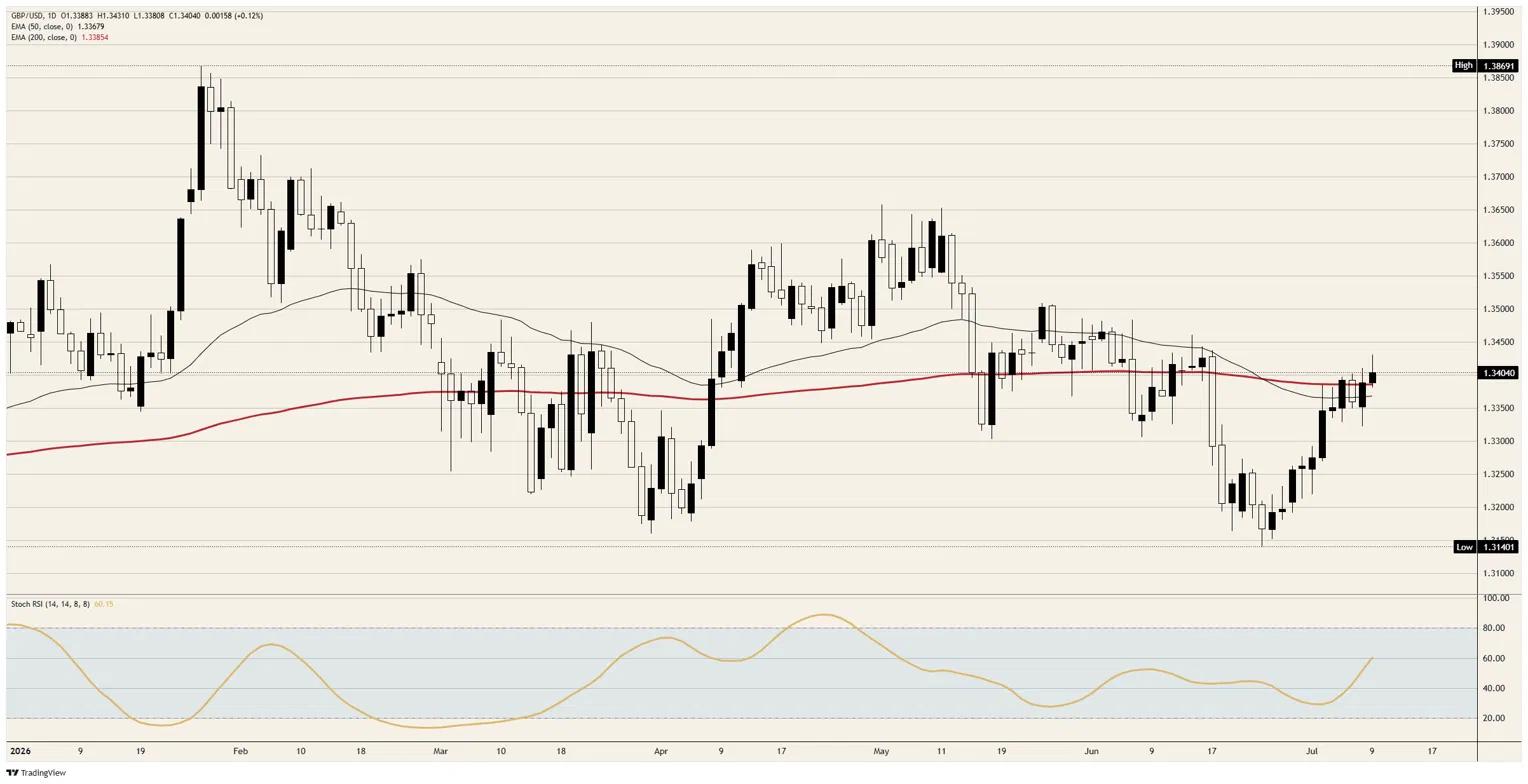
- GBP/USD trades at 1.3404 on Thursday, clearing the 200-day EMA for the first time since mid-June.
- Hawkish Federal Reserve rhetoric and a second night of American strikes on Iran fail to put a bid under the Dollar.
- Labour nominations run to July 16, with an effectively unopposed Andy Burnham set to be declared leader on July 17 and Prime Minister three days later.
Cable adds roughly a tenth of a percent on Thursday, changing hands a whisker above 1.3400 and poking through the 200-day Exponential Moving Average (EMA) for the first time since mid-June. The setting makes the move notable: the United States traded overnight strikes with Iran for a second consecutive day, Crude Oil carries a war premium, and Federal Reserve (Fed) speakers spent the session sounding hawkish. None of it bought the Dollar anything against the Pound.
Washington supplies hawks and airstrikes, and the Dollar shrugs
Thursday's American docket gave Dollar bulls usable material, starting with Initial Jobless Claims printing 215K at 12:30 GMT against a 218K consensus and a 217K prior. A voting Federal Open Market Committee (FOMC) member delivered remarks rated firmly hawkish at 13:00 GMT, another policymaker speaks at 17:30 GMT, and Existing Home Sales falling 2.4% MoM in June stands as the lone soft spot on the tape.
The geopolitical backdrop leaned the same way. American forces hit roughly 90 targets across Iran overnight after Tehran attacked shipping in the Strait of Hormuz, Washington reimposed Crude Oil sanctions, and the interim peace framework signed last month is functionally suspended. A reserve currency that cannot rally on hawkish rhetoric plus a Middle East war bid is a reserve currency whose buyers are already positioned, and market pricing of roughly three-in-four odds of a July Fed hold explains the fatigue.
Threadneedle Street's dissenters meet the King of the North
Sterling's side of the ledger keeps improving at the margin, anchored by a Bank of England that held at 3.75% in June on a 7-2 vote, with two policymakers pushing for 4.00% against a single dissent in April. Services inflation at 3.7% and a household energy cap rising 13.5% into the third quarter keep that bloc armed, and markets now assign roughly 76% odds to a hike before year-end. A Deputy Governor's appearance at 09:30 GMT came and went without disturbing that pricing.
The political vacancy is resolving on schedule, with nominations to replace Keir Starmer opening Thursday and running to July 16. Andy Burnham faces no declared challenger, and the timetable delivers a new Labour leader on July 17 and a new Prime Minister on July 20. The currency has treated the transition as resolved for two weeks; what remains unpriced is the fiscal program, since Burnham has named no Chancellor and his Manchesterism platform implies spending Westminster has not yet costed.
Continuation or head-fake, the map for both
The continuation case is straightforward mechanics: a daily close above the 200-day EMA sitting just shy of 1.3400 converts a two-week short-covering grind into a trend signal, and the Stochastic Relative Strength Index at 60 and rising leaves room before overbought territory forces the issue. The path runs through 1.3450 toward 1.3500, the shelf that rejected the June advance, with rate differentials leaning Sterling's way into a hawkish Bank of England and a paused Fed.
The reversal case deserves equal billing because this is the third assault on this moving-average cluster since May, and the 50-day EMA still running below the 200-day leaves the broader alignment bearish even as price escapes. A hot US Consumer Price Index (CPI) print on Tuesday would re-arm the Fed hike trade overnight, Thursday brings May Gross Domestic Product (GDP) figures after April's 0.1% contraction, and any Burnham fiscal headline lands on a gilt market with a long memory. A failure that produces a daily close back below 1.3350 reframes the July recovery as positioning noise and exposes 1.3300.
A silent Friday before the calendar turns hostile
Friday's docket is empty on both sides of the Atlantic, leaving the pair to trade Hormuz headlines and pre-CPI positioning in thinning summer liquidity. The quiet does not last: British Retail Consortium (BRC) Like-For-Like Retail Sales open the week on Monday at 23:01 GMT after a 3.4% prior, and Tuesday's US CPI at 12:30 GMT is the event of the month, with the calendar showing a minus 0.1% MoM headline consensus after 0.5% and core seen steady at 2.9% YoY.
Wednesday follows with Producer Price Index data and the Fed's Beige Book, and Thursday stacks the UK's May GDP, Industrial Production, and Manufacturing Production prints at 06:00 GMT against US Retail Sales at 12:30 GMT, seen cooling to 0.3% from 0.9%. Friday, July 17 delivers the University of Michigan preliminaries and, if nominations hold to form, a Labour leader confirmed at a special conference, handing Cable a new government and a fresh fiscal narrative inside five trading days.
Pound Sterling technical levels to watch
Resistance: 1.3450 caps the immediate advance, and beyond it 1.3500 marks the shelf that turned back the June rally; a weekly close through that zone opens 1.3650.
Support: The 200-day EMA just shy of 1.3400 is the line that validates or kills the breakout, with the 50-day EMA a touch above 1.3350 behind it and 1.3300 as the level where the July recovery would be declared dead.
Bias: Bullish while daily closes hold above the 200-day EMA, targeting 1.3450 then 1.3500; a daily close back below 1.3350 flips the call and targets 1.3300.
GBP/USD daily chart
Pound Sterling FAQs
The Pound Sterling (GBP) is the oldest currency in the world (886 AD) and the official currency of the United Kingdom. It is the fourth most traded unit for foreign exchange (FX) in the world, accounting for 12% of all transactions, averaging $630 billion a day, according to 2022 data. Its key trading pairs are GBP/USD, also known as ‘Cable’, which accounts for 11% of FX, GBP/JPY, or the ‘Dragon’ as it is known by traders (3%), and EUR/GBP (2%). The Pound Sterling is issued by the Bank of England (BoE).
The single most important factor influencing the value of the Pound Sterling is monetary policy decided by the Bank of England. The BoE bases its decisions on whether it has achieved its primary goal of “price stability” – a steady inflation rate of around 2%. Its primary tool for achieving this is the adjustment of interest rates. When inflation is too high, the BoE will try to rein it in by raising interest rates, making it more expensive for people and businesses to access credit. This is generally positive for GBP, as higher interest rates make the UK a more attractive place for global investors to park their money. When inflation falls too low it is a sign economic growth is slowing. In this scenario, the BoE will consider lowering interest rates to cheapen credit so businesses will borrow more to invest in growth-generating projects.
Data releases gauge the health of the economy and can impact the value of the Pound Sterling. Indicators such as GDP, Manufacturing and Services PMIs, and employment can all influence the direction of the GBP. A strong economy is good for Sterling. Not only does it attract more foreign investment but it may encourage the BoE to put up interest rates, which will directly strengthen GBP. Otherwise, if economic data is weak, the Pound Sterling is likely to fall.
Another significant data release for the Pound Sterling is the Trade Balance. This indicator measures the difference between what a country earns from its exports and what it spends on imports over a given period. If a country produces highly sought-after exports, its currency will benefit purely from the extra demand created from foreign buyers seeking to purchase these goods. Therefore, a positive net Trade Balance strengthens a currency and vice versa for a negative balance.
Recommended Articles


