

Pound Sterling claws off the floor and finds a ceiling
- GBP/USD has clawed back from its late-June lows but stalled beneath a band of overhead resistance.
- The recovery looks corrective rather than a genuine turn, capped by two falling averages stacked overhead.
- A hawkish Bank of England and a hollow political backdrop are pulling the Pound in opposite directions.
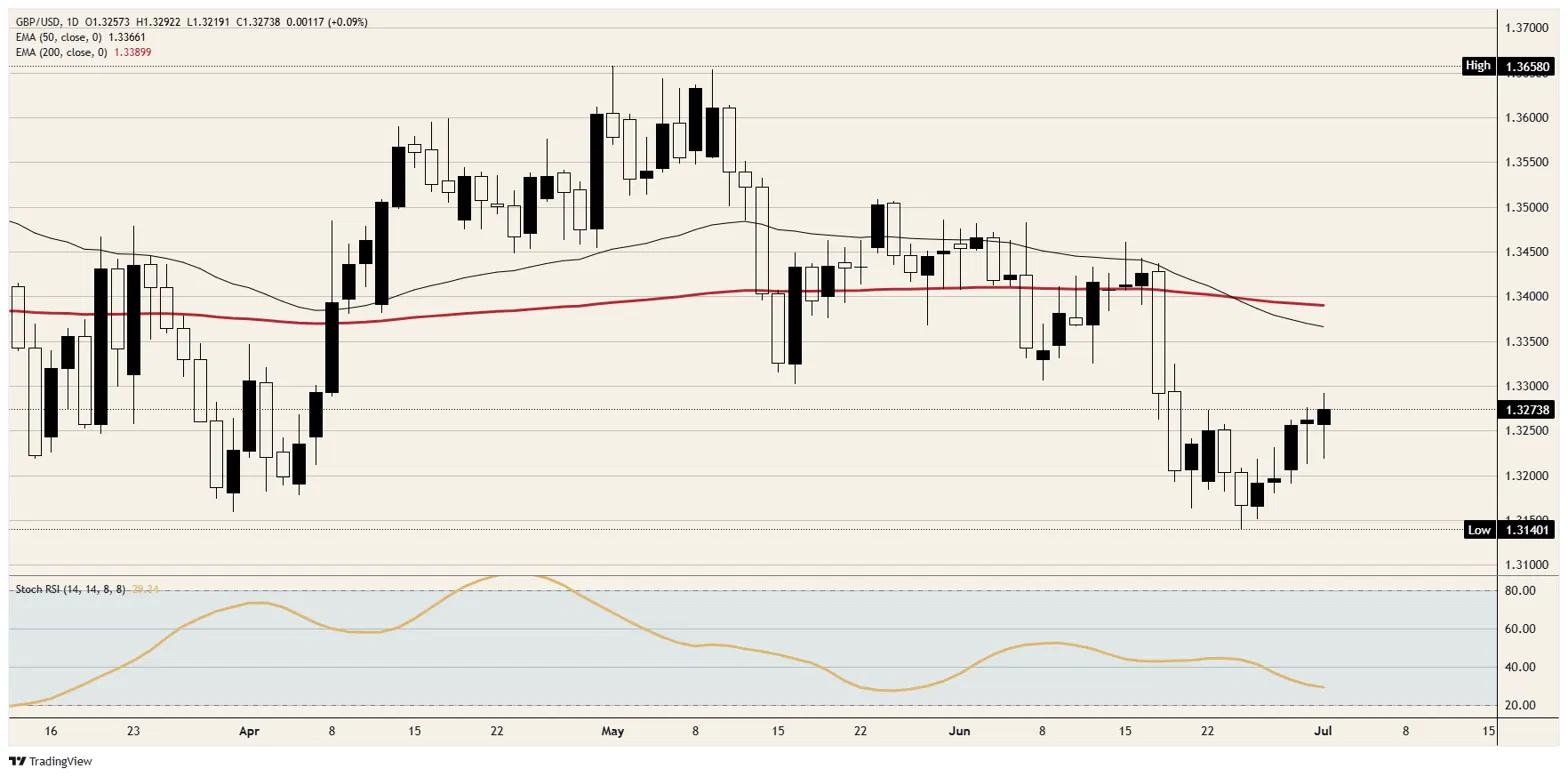
Pound Sterling has spent the past week fighting for every pip, and the effort is starting to show its limits. After bottoming near 1.3150 in late June, GBP/USD has clawed back toward the 1.3300 area, only to run into a ceiling formed by its 50-day and 200-day Exponential Moving Averages (EMA), now stacked one atop the other overhead. The Stochastic Relative Strength Index (Stoch RSI) has rolled over from higher levels, a sign the bounce is tiring before it has cleared any real hurdle.
A bounce, not a base
The distinction between a recovery and a reversal is the whole question here. Moving off a low is not the same as building strength; a market that has fallen far enough will always attract some buying, and that is most of what the past week represents. With both major averages sloping lower and price still trapped beneath them, the path of least resistance points sideways to lower until the Pound proves otherwise with a close above the ceiling.
Hawks and a hollow centre
The Pound's trouble is that its two biggest drivers pull against each other. On one side, the Bank of England (BoE) held rates last month with a hawkish split and a firm message, handing Sterling a genuine yield-based floor. On the other, the resignation of the Prime Minister has left a political vacuum at the worst possible moment, capping enthusiasm for the currency so that every rally meets a seller. The result is a Pound suspended between a floor it cannot fall through and a ceiling it cannot break.
The week's tests
The calendar keeps the Pound busy on both sides of the Atlantic. The Bank of England Governor speaks today at 13:00 GMT and again on Friday at 15:00 GMT, with a further appearance from a rate-setter on Thursday, any of which could sharpen or soften the message underpinning Sterling's floor. The larger event sits in Washington, where United States Nonfarm Payrolls (NFP) land on Thursday at 12:30 GMT, pulled forward by the Independence Day holiday, with consensus near 110K against a prior 172K. A soft print would weaken the Dollar broadly and hand the Pound a lift it has struggled to manufacture itself.
Levels to watch
Resistance: The stacked 50-day and 200-day averages between roughly 1.3350 and 1.3400 form the ceiling that defines this move; a daily close above the band is the minimum needed to argue the bounce has become something more. Above there, the 1.3500 area marks the next real barrier.
Support: The recent base near 1.3250 is the first line to watch, and losing it on a closing basis would put the late-June low near 1.3150 back in play. Beneath that, there is little to arrest a slide before the figure gives way.
Bias: Corrective and lower-biased while GBP/USD stays trapped under the 1.3350 to 1.3400 ceiling and its two falling averages. The near-term burden of proof sits with the bulls; only a decisive daily close above 1.3400 would turn the structure and signal a real recovery rather than a bounce, while a close back below 1.3250 reopens the path to the June low. Absent that break higher, strength is to be sold into the ceiling rather than chased.
GBP/USD daily chart
Pound Sterling FAQs
The Pound Sterling (GBP) is the oldest currency in the world (886 AD) and the official currency of the United Kingdom. It is the fourth most traded unit for foreign exchange (FX) in the world, accounting for 12% of all transactions, averaging $630 billion a day, according to 2022 data. Its key trading pairs are GBP/USD, also known as ‘Cable’, which accounts for 11% of FX, GBP/JPY, or the ‘Dragon’ as it is known by traders (3%), and EUR/GBP (2%). The Pound Sterling is issued by the Bank of England (BoE).
The single most important factor influencing the value of the Pound Sterling is monetary policy decided by the Bank of England. The BoE bases its decisions on whether it has achieved its primary goal of “price stability” – a steady inflation rate of around 2%. Its primary tool for achieving this is the adjustment of interest rates. When inflation is too high, the BoE will try to rein it in by raising interest rates, making it more expensive for people and businesses to access credit. This is generally positive for GBP, as higher interest rates make the UK a more attractive place for global investors to park their money. When inflation falls too low it is a sign economic growth is slowing. In this scenario, the BoE will consider lowering interest rates to cheapen credit so businesses will borrow more to invest in growth-generating projects.
Data releases gauge the health of the economy and can impact the value of the Pound Sterling. Indicators such as GDP, Manufacturing and Services PMIs, and employment can all influence the direction of the GBP. A strong economy is good for Sterling. Not only does it attract more foreign investment but it may encourage the BoE to put up interest rates, which will directly strengthen GBP. Otherwise, if economic data is weak, the Pound Sterling is likely to fall.
Another significant data release for the Pound Sterling is the Trade Balance. This indicator measures the difference between what a country earns from its exports and what it spends on imports over a given period. If a country produces highly sought-after exports, its currency will benefit purely from the extra demand created from foreign buyers seeking to purchase these goods. Therefore, a positive net Trade Balance strengthens a currency and vice versa for a negative balance.
Recommended Articles


