

The Japanese Yen dares Tokyo to defend a line it won't name
- USD/JPY printed fresh multi-decade highs, pushing further above the level markets associate with official discomfort.
- The paradox is that the Yen keeps weakening even after the Bank of Japan raised rates last month.
- Verbal warnings are building, but the rate gap with the United States is doing the talking.
The Japanese Yen has done something close to remarkable and been punished for it anyway. The Bank of Japan (BoJ) lifted its policy rate to one percent last month, its first meaningful tightening in a generation, yet USD/JPY has spent the days since grinding to fresh multi-decade highs above the 162.00 handle. The market is not confused; it is simply doing the arithmetic, and the arithmetic still favours the Dollar.
The arithmetic beats the message
The reason is a rate differential that dwarfs anything a single quarter-point move can close. Even after the hike, roughly 275 basis points separate the Federal Reserve's policy rate from the Bank of Japan's, and the Fed held firm last month with a hawkish message of its own. Carry traders keep borrowing cheap Yen to buy higher-yielding Dollars, and until that spread narrows, every rally is funded by the gap rather than by conviction.
A line nobody will draw
The theatre plays out through the currency's guardians and their vocabulary of concern. Japanese officials have leaned harder on their warnings as the pair has climbed, running the familiar path from watching markets closely to insisting no option is off the table. The Ministry of Finance (MoF) holds an implicit line near the 160.00 level, the zone that has drawn official action before, yet it will not name the number it would defend. Traders are pressing precisely because that silence reads as hesitation.
Why intervention buys time, not a turn
The more revealing question is what happens if Tokyo actually steps in. History says direct Yen buying can jolt the pair several figures lower in one session, and it has done exactly that in the recent past. What it cannot do is change the rate gap that created the pressure, so the likelier result is a cheaper level for carry traders to re-enter, not a durable reversal. A spike lower would be a gift to the very positions it is meant to punish.
The data that could force the issue
The calendar hands the pair its next test on Thursday. United States Nonfarm Payrolls (NFP) arrive at 12:30 GMT, pulled forward from Friday by the Independence Day holiday, with consensus near 110K against a prior 172K and unemployment seen holding at 4.3 percent. Today's private payrolls already came in soft, and a weak headline would drag US yields and the Dollar lower, doing the job Tokyo has been reluctant to do itself. A firm print would instead widen the gap driving the Yen down and dare the authorities to respond.
Levels to watch
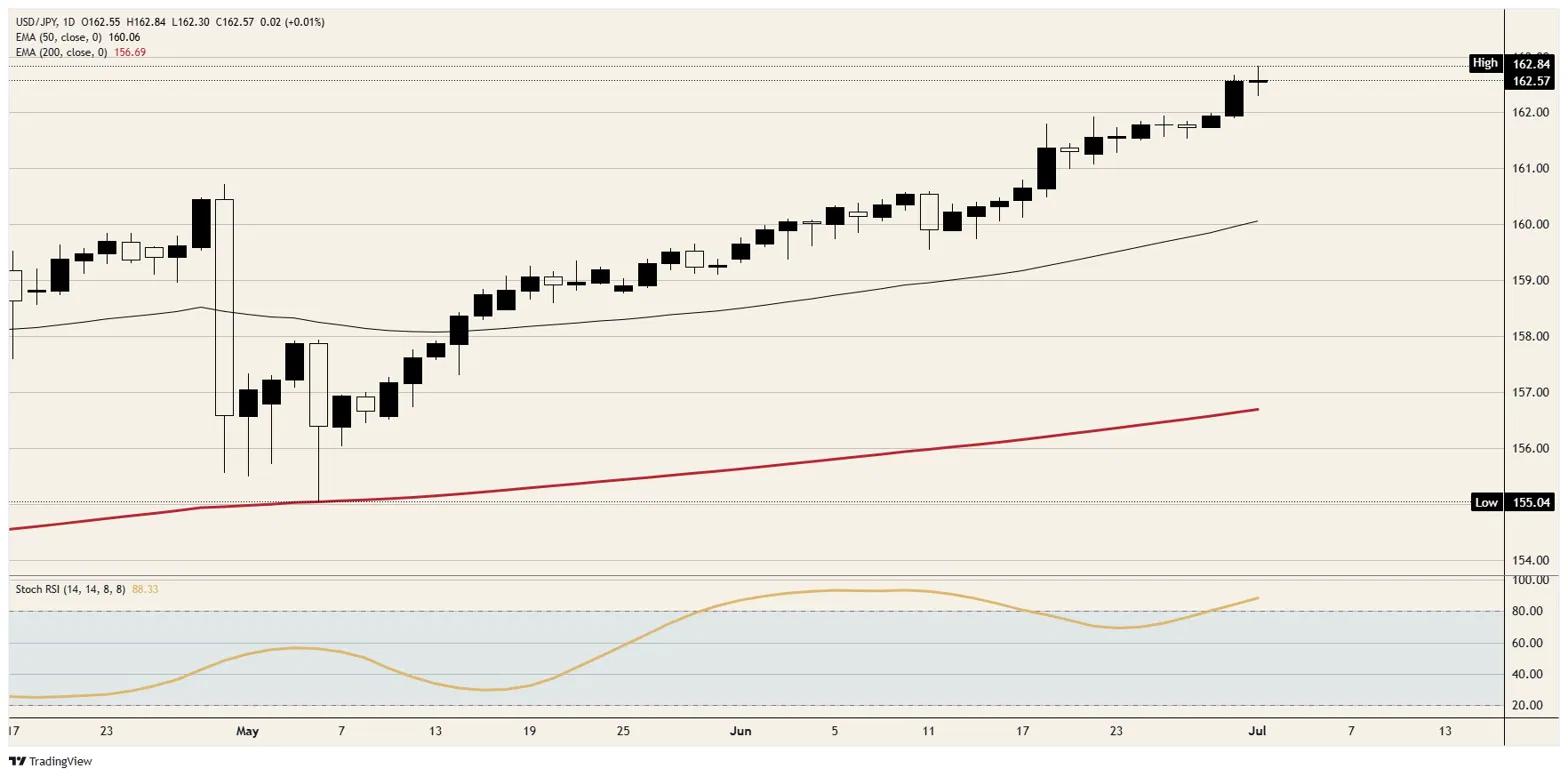
Resistance: The 163.00 handle is the immediate barrier after the run to fresh highs, with the 164.00 level the next marker if momentum extends. Round-number resistance up here doubles as intervention risk, because the higher the pair climbs, the shorter the odds that Tokyo finally acts.
Support: The 160.00 level is the line that matters, serving as both psychological support and the zone the Ministry of Finance is thought to defend, with the 50-day Exponential Moving Average (EMA) sitting right on it. A daily close below there would signal either successful intervention or a real shift in the rate story, and 158.50 is the next foothold beneath.
Bias: Bullish while price holds above the 160.00 level and its 50-day average, with the rate differential still doing the heavy lifting. Momentum is stretched, and the Stochastic Relative Strength Index (Stoch RSI) sits deep in overbought territory, but a stretched oscillator has rarely been enough to halt a trend this well-funded. The call flips only on a decisive close back under 160.00, whether forced by intervention or by a real narrowing of the gap with the United States; short of that, dips remain the market's invitation to re-enter.
USD/JPY daily chart
Japanese Yen FAQs
The Japanese Yen (JPY) is one of the world’s most traded currencies. Its value is broadly determined by the performance of the Japanese economy, but more specifically by the Bank of Japan’s policy, the differential between Japanese and US bond yields, or risk sentiment among traders, among other factors.
One of the Bank of Japan’s mandates is currency control, so its moves are key for the Yen. The BoJ has directly intervened in currency markets sometimes, generally to lower the value of the Yen, although it refrains from doing it often due to political concerns of its main trading partners. The BoJ ultra-loose monetary policy between 2013 and 2024 caused the Yen to depreciate against its main currency peers due to an increasing policy divergence between the Bank of Japan and other main central banks. More recently, the gradually unwinding of this ultra-loose policy has given some support to the Yen.
Over the last decade, the BoJ’s stance of sticking to ultra-loose monetary policy has led to a widening policy divergence with other central banks, particularly with the US Federal Reserve. This supported a widening of the differential between the 10-year US and Japanese bonds, which favored the US Dollar against the Japanese Yen. The BoJ decision in 2024 to gradually abandon the ultra-loose policy, coupled with interest-rate cuts in other major central banks, is narrowing this differential.
The Japanese Yen is often seen as a safe-haven investment. This means that in times of market stress, investors are more likely to put their money in the Japanese currency due to its supposed reliability and stability. Turbulent times are likely to strengthen the Yen’s value against other currencies seen as more risky to invest in.
Recommended Articles


