


EUR/GBP Price Forecast: Bulls test 100-day SMA as UK political turmoil weighs on Pound
- EUR/GBP hits a three-week high on Tuesday as UK political turmoil weighs on the British Pound.
- The Euro struggles to gain traction amid concerns over the Eurozone’s exposure to Middle East-driven energy shocks.
- Technically, the cross remains capped below the 100-day and 200-day SMAs despite improving momentum indicators.
EUR/GBP trims part of its earlier gains on Tuesday as traders assess rising political instability in the United Kingdom and stalled US-Iran negotiations. At the time of writing, the cross is trading around 0.8679 after hitting a three-week high of 0.8697 earlier in the day, though it remains up roughly 0.25%.
The British Pound (GBP) trades on the defensive across the board as pressure continues to mount on Prime Minister Keir Starmer following Labour’s heavy losses in the recent local elections. According to reports, 78 of Labour’s 403 MPs have called on Starmer to step aside, just short of the 81 MPs needed to trigger a formal leadership contest. Meanwhile, Starmer has publicly rejected calls to resign, stating that he will “get on with governing.”
At the same time, the Euro (EUR) is also struggling to gain meaningful traction as concerns over the economic fallout from the ongoing Middle East conflict continue to weigh on sentiment. The Eurozone’s heavy exposure to rising energy costs and supply disruptions linked to the Strait of Hormuz is fueling fears of slower growth and renewed inflationary pressure, leaving the upside in EUR/GBP limited in the near term.
Looking ahead, traders will focus on upcoming economic data from the Eurozone and the United Kingdom for fresh direction. On Wednesday, the Eurozone will release preliminary Q1 Employment Change and Gross Domestic Product (GDP) figures, along with March Industrial Production data.
In the UK, monthly GDP data for March, preliminary Q1 GDP figures, as well as Industrial Production and Manufacturing Production data, are scheduled for release on Thursday.
Technical Analysis:
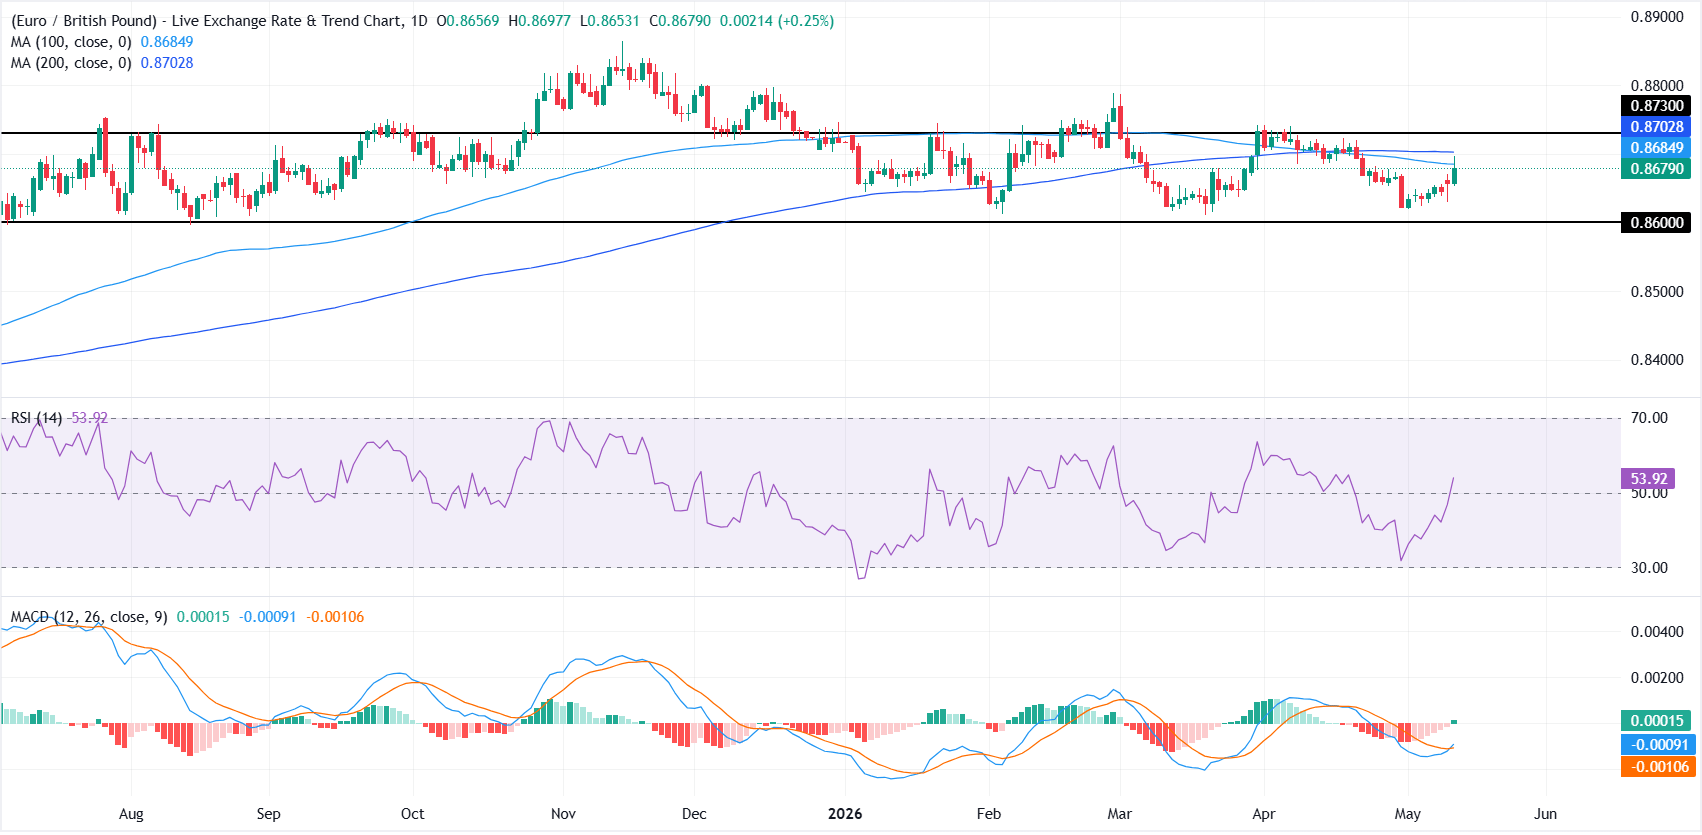
On the daily chart, EUR/GBP keeps a capped near-term tone as it holds below both the 100-day Simple Moving Average (SMA) and the 200-day SMA. The Relative Strength Index (RSI has recovered toward 54 and the Moving Average Convergence Divergence (MACD) has inched back into slightly positive territory, suggesting modest bullish momentum, yet these signals remain constrained by the overhead moving average barrier.
On the topside, initial resistance aligns with the 100-day SMA at 0.8685, followed by the 200-day SMA at 0.8703, with a stronger hurdle at the horizontal resistance level of 0.8730. On the downside, the key structural floor is seen at the 0.8600 horizontal support, where a break would reopen a deeper pullback despite the current attempt to stabilize.
(The technical analysis of this story was written with the help of an AI tool.)
Pound Sterling Price Today
The table below shows the percentage change of British Pound (GBP) against listed major currencies today. British Pound was the strongest against the Swiss Franc.
| USD | EUR | GBP | JPY | CAD | AUD | NZD | CHF | |
|---|---|---|---|---|---|---|---|---|
| USD | 0.37% | 0.65% | 0.22% | 0.20% | 0.36% | 0.27% | 0.43% | |
| EUR | -0.37% | 0.27% | -0.13% | -0.20% | -0.02% | -0.11% | 0.07% | |
| GBP | -0.65% | -0.27% | -0.43% | -0.48% | -0.30% | -0.36% | -0.21% | |
| JPY | -0.22% | 0.13% | 0.43% | -0.06% | 0.10% | 0.03% | 0.18% | |
| CAD | -0.20% | 0.20% | 0.48% | 0.06% | 0.16% | 0.08% | 0.23% | |
| AUD | -0.36% | 0.02% | 0.30% | -0.10% | -0.16% | -0.07% | 0.07% | |
| NZD | -0.27% | 0.11% | 0.36% | -0.03% | -0.08% | 0.07% | 0.15% | |
| CHF | -0.43% | -0.07% | 0.21% | -0.18% | -0.23% | -0.07% | -0.15% |
The heat map shows percentage changes of major currencies against each other. The base currency is picked from the left column, while the quote currency is picked from the top row. For example, if you pick the British Pound from the left column and move along the horizontal line to the US Dollar, the percentage change displayed in the box will represent GBP (base)/USD (quote).
Recommended Articles


