


Iron Ore Futures (IRONORE-F) Drops on Jul 30: What Lie behind the Move?
Iron Ore Futures (IRONORE-F) is down 2.18% at Jul 30 02:10(ET), now at $714.9, with a 7-day down of 3.43%.
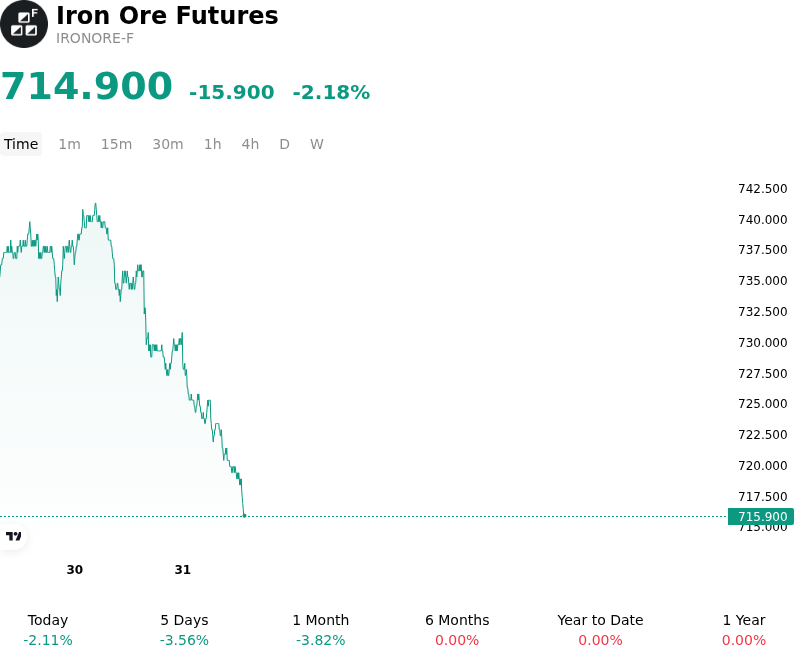
What is driving Iron Ore Futures (IRONORE-F)’s stock price down today?
The downward pressure on iron ore futures is primarily driven by a deterioration in the demand outlook from Chinese steel mills as seasonal construction activity faces significant headwinds. Recent high-frequency data suggests that steel consumption remains sluggish, exacerbated by persistent weakness in the residential property sector and a lack of aggressive fiscal stimulus to support new infrastructure projects. As mills face narrowing profit margins, there is an increasing shift toward production cuts to manage rising finished steel inventories, which directly reduces the immediate requirement for seaborne iron ore replenishment.
On the supply side, port inventories in China have continued to accumulate, reaching levels that suggest a well-supplied market despite any previous concerns regarding shipment disruptions. The steady increase in arrivals from major producers in Australia and Brazil has outpaced domestic consumption rates, shifting the physical market balance toward a surplus. This inventory overhang is exerting downward pressure on spot prices, leading institutional investors to revise their near-term price targets and reduce long positions in the futures market.
Macroeconomic sentiment is further dampened by the absence of significant monetary easing from the People's Bank of China. While investors had anticipated more direct support for the credit-intensive real estate sector, the current policy stance appears focused on structural deleveraging rather than broad-based stimulus. This has led to a repricing of industrial growth expectations for the second half of the year, as the manufacturing sector struggles to find a sustainable recovery catalyst amid global economic uncertainty.
Furthermore, the recent trajectory of the US dollar has added a layer of resistance for dollar-denominated commodities. As global risk appetite fluctuates based on interest rate expectations in developed markets, iron ore remains particularly sensitive to shifts in currency valuations. The combination of high domestic supply, lackluster demand from the end-use construction sector, and a challenging macro environment suggests that the market is currently prioritizing downside risks as it re-evaluates the structural demand floor for the remainder of the quarter.
Technical Analysis of Iron Ore Futures (IRONORE-F)
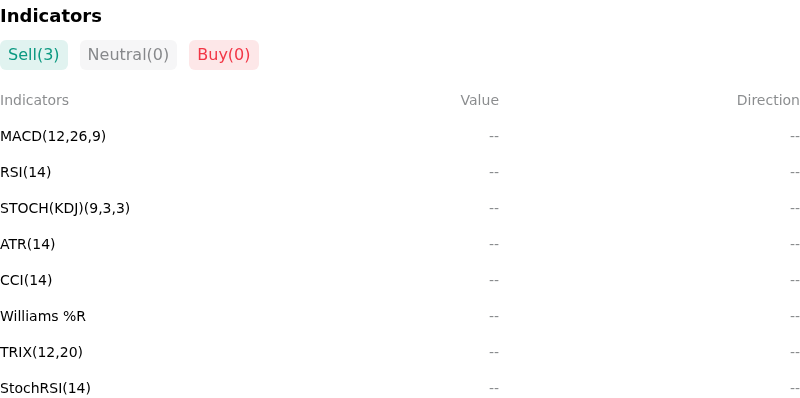
Technically, Iron Ore Futures (IRONORE-F) shows a MACD (12,26,9) value of -4.988, indicating a sell signal. The RSI at 27.851 suggests sell condition and the Williams %R at 100.000 suggests oversold condition. Please monitor closely.
More details about Iron Ore Futures (IRONORE-F)
Recent Events and Risks:
- China Steel Production Caps: Renewed signals from the National Development and Reform Commission (NDRC) regarding strict annual crude steel output limits to meet environmental targets pose a direct threat to iron ore consumption volumes for the remainder of the quarter.
- Surging Port Inventories: Data from major Chinese ports indicates iron ore stockpiles have reached multi-month highs, suggesting a significant supply-demand mismatch as arrivals from Australia and Brazil outpace current mill intake.
- Persistent Real Estate Weakness: Disappointing new home start figures and a lack of aggressive fiscal stimulus for the Chinese construction sector continue to dampen long-term steel demand expectations, pressuring iron ore futures lower.
- Mill Margin Compression: Shrinking profitability among Chinese blast furnace operators due to weak finished steel prices is triggering early furnace maintenance and a shift toward lower-grade ores, reducing liquidity and demand for benchmark futures.
Recommended Articles


