


Wells Fargo & Co Stock (WFC) Closed Down by 3.19% on Jul 29: What Investors Need To Know
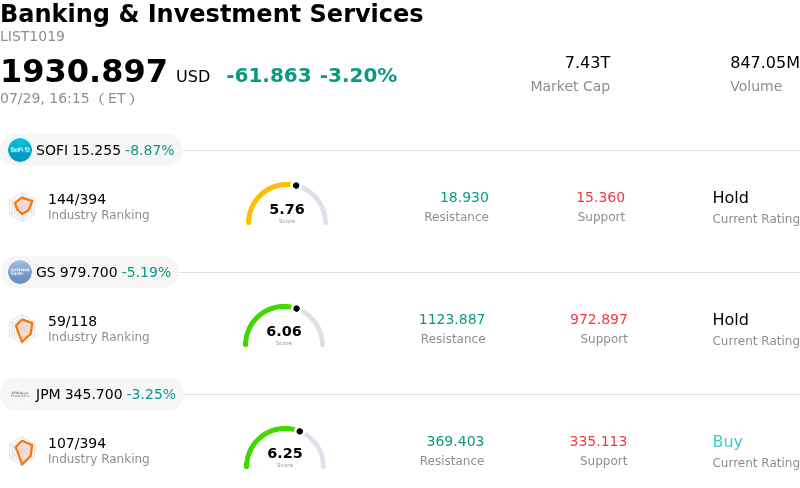
Wells Fargo & Co (WFC) closed down by 3.19%. The Banking & Investment Services sector is down by 3.20%. The company outperformed the industry. Top 3 stocks by turnover in the sector: SoFi Technologies Inc (SOFI) down 8.87%; Goldman Sachs Group Inc (GS) down 5.19%; JPMorgan Chase & Co (JPM) down 3.25%.
What is driving Wells Fargo & Co (WFC)’s stock price down today?
Wells Fargo’s current performance reflects a confluence of regulatory scrutiny and shifting macroeconomic expectations that have weighed heavily on investor sentiment. The primary driver of the downward pressure appears to be renewed concerns regarding the timeline for the removal of the Federal Reserve-imposed asset cap. Reports suggesting that the bank still faces significant hurdles in satisfying long-standing compliance requirements have led to a sharp reassessment of its medium-term growth potential, as the inability to expand the balance sheet continues to limit its competitive position relative to its large-cap peers.
Furthermore, the broader financial sector is navigating a complex interest rate environment. With the Federal Reserve maintaining a cautious stance on monetary policy, the outlook for net interest income remains clouded. Market participants are increasingly wary of potential margin compression if funding costs remain elevated while loan demand softens. This high sensitivity to the yield curve has exacerbated intraday volatility, particularly as institutional investors adjust their exposure in anticipation of economic data that could dictate the trajectory of inflation and employment for the remainder of the year.
Credit quality concerns also play a significant role in the current market reaction. As the economy transitions through a period of decelerating growth, there is a heightened focus on the bank’s commercial real estate exposure and its provisions for credit losses. Any indication of rising delinquencies or a perceived need to bolster reserves tends to trigger a defensive rotation out of money-center banks. The combination of these fundamental headwinds and technical selling pressure has resulted in the observed volatility, as the market seeks a new equilibrium point amidst the ongoing uncertainty.
Finally, institutional portfolio adjustments have contributed to the stock’s weakness. The volatility was likely amplified by high-frequency trading algorithms reacting to breached technical support levels and systematic rebalancing within major financial exchange-traded funds. As analysts recalibrate their earnings forecasts to account for higher operational costs and persistent regulatory expenses, the lack of a clear catalyst for an immediate recovery has left the stock vulnerable to short-term outflows. Until there is more definitive clarity regarding the regulatory path forward, the shares are expected to remain highly sensitive to both sector-specific news and broader macroeconomic indicators.
Technical Analysis of Wells Fargo & Co (WFC)
Technically, Wells Fargo & Co (WFC) shows a MACD (12,26,9) value of -0.505, indicating a neutral signal. The RSI at 55.070 suggests neutral condition and the Williams %R at 48.993 suggests neutral condition. Please monitor closely.
Media Coverage of Wells Fargo & Co (WFC)
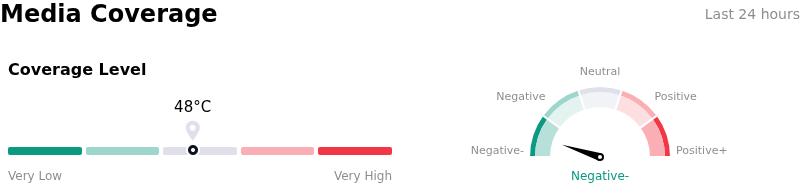
In terms of media coverage, Wells Fargo & Co (WFC) shows a coverage score of 48, indicating a moderate level of media attention. The overall market sentiment index is currently in extremely bearish zone.
Fundamental Analysis of Wells Fargo & Co (WFC)
Wells Fargo & Co (WFC) is in the Banking & Investment Services industry. Its latest annual revenue is $81.45B, ranking 3 in the industry. The net profit is $20.29B, ranking 4 in the industry. Company Profile
Over the past month, multiple analysts have rated the company as Buy, with an average price target of $100.00, a high of $108.00, and a low of $90.00.
More details about Wells Fargo & Co (WFC)
Company Specific Risks:
- Net Interest Income Compression: Recent management commentary at industry conferences has reaffirmed a projected 7% to 9% decline in net interest income for the year, as persistent deposit migration to higher-yielding accounts continues to increase funding costs and squeeze margins.
- Commercial Real Estate Credit Deterioration: Significant exposure to the office loan sector remains a primary driver of volatility, with institutional analysts highlighting that the bank is still in the early stages of a prolonged downturn in property valuations, necessitating high credit loss provisions.
- Regulatory Asset Cap Constraints: The Federal Reserve’s $1.95 trillion asset cap remains a major structural overhang, preventing the bank from expanding its balance sheet to compete for market share in high-growth segments while rivals operate without similar restrictions.
- Elevated Non-Interest Expenses: Higher-than-anticipated spending on risk management remediation and technology infrastructure upgrades continues to pressure the bank’s efficiency ratio, complicating efforts to meet long-term profitability targets in a cooling macro environment.
Recommended Articles


