


Silver/AUD (XAGAUD) Drops on Jul 28: Key Factors to Watch
Silver/AUD (XAGAUD) is down 2.04% at Jul 28 01:30(ET), now at $81.802, with a 7-day down of 2.56%.
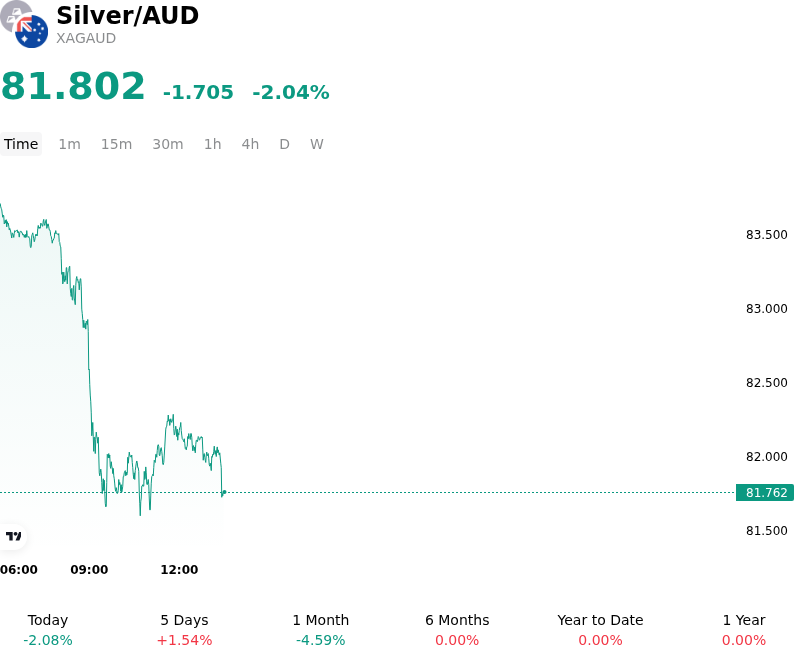
What is driving Silver/AUD (XAGAUD)’s stock price down today?
The primary pressure on silver prices stems from a significant repricing of global interest rate expectations. Recent hawkish signaling from the U.S. Federal Reserve, supported by resilient inflation data, has pushed real yields higher. As silver is a non-yielding asset, the increase in the opportunity cost of holding the metal has triggered institutional outflows and technical selling. This shift in the yield curve has overshadowed silver's traditional role as an inflation hedge, particularly as the market anticipates a prolonged period of restrictive monetary policy to ensure price stability.
Softening industrial sentiment is simultaneously weighing on silver’s demand outlook. Given its extensive use in the electronics and photovoltaic sectors, silver remains highly sensitive to manufacturing PMI data and global industrial production cycles. Recent reports indicating a slowdown in industrial activity, combined with a lack of major new stimulus measures from China, have led to a downward revision in industrial consumption forecasts. This demand-side fragility is exacerbating the downward pressure caused by the broader macroeconomic environment and rising yields.
The decline in the XAGAUD cross is further intensified by the relative resilience of the Australian dollar. Domestic factors, including a hawkish stance from the Reserve Bank of Australia and stable prices for bulk commodity exports like iron ore, have provided a floor for the AUD. When the local currency remains firm while the underlying commodity price falls in U.S. dollar terms, the depreciation in Australian dollar-denominated silver is magnified. Institutional capital flows reflect this divergence, with fund managers reducing long silver exposure in favor of higher-yielding sovereign debt or currency-linked assets.
Inventory levels at major global exchanges remain sufficient to meet current demand, which has removed any immediate supply-side premium from the market. From a technical perspective, the breach of key psychological support levels has accelerated the move as systematic trading models and stop-loss orders were triggered. The current market balance reflects a short-term surplus, driven by the liquidation of exchange-traded fund holdings and a shift in investor sentiment toward a more defensive posture regarding precious metals. Investors are now closely monitoring whether this correction marks a structural shift or a temporary reaction to the prevailing interest rate trajectory.
Technical Analysis of Silver/AUD (XAGAUD)
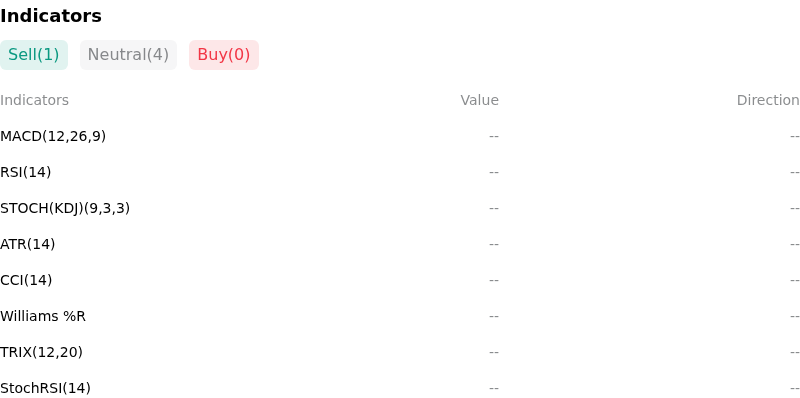
Technically, Silver/AUD (XAGAUD) shows a MACD (12,26,9) value of 0.000, indicating a neutral signal. The RSI at 38.673 suggests neutral condition and the Williams %R at 62.673 suggests sell condition. Please monitor closely.
More details about Silver/AUD (XAGAUD)
Recent Events and Risks:
- Macroeconomic Pressure from US Monetary Policy: Recent hawkish commentary from Federal Reserve officials and stronger-than-expected US labor market data have reinforced a "higher-for-longer" interest rate outlook, elevating real yields and increasing the opportunity cost of holding non-yielding silver, which pressures the XAG component.
- Australian Dollar Appreciation Risk: Unexpectedly sticky domestic inflation data in Australia has prompted market speculation of a potential Reserve Bank of Australia (RBA) rate hike or a delayed easing cycle; as the denominator in the XAGAUD pair, a strengthening Australian Dollar directly forces the cross-rate lower.
- Weakening Chinese Industrial Demand: Recent manufacturing PMI data and reports of overcapacity in the Chinese photovoltaic (solar) sector suggest a near-term slowdown in industrial silver consumption, as reduced production of solar modules and electronics weakens the fundamental demand floor for the metal.
- Technical Exhaustion and Position Liquidation: Following a period of aggressive long-positioning, silver faces downside risk from a "long squeeze" if prices fail to maintain key technical support levels, particularly as institutional traders look to hedge against volatility by liquidating commodity-linked AUD exposures.
Recommended Articles


