


XRP (XRPUSD) Volatility Intensified on Jul 27: What You Should Know
XRP (XRPUSD) is up 1.04% at Jul 27 02:10(ET), now at $1.1121, with a 7-day down of 0.22%.
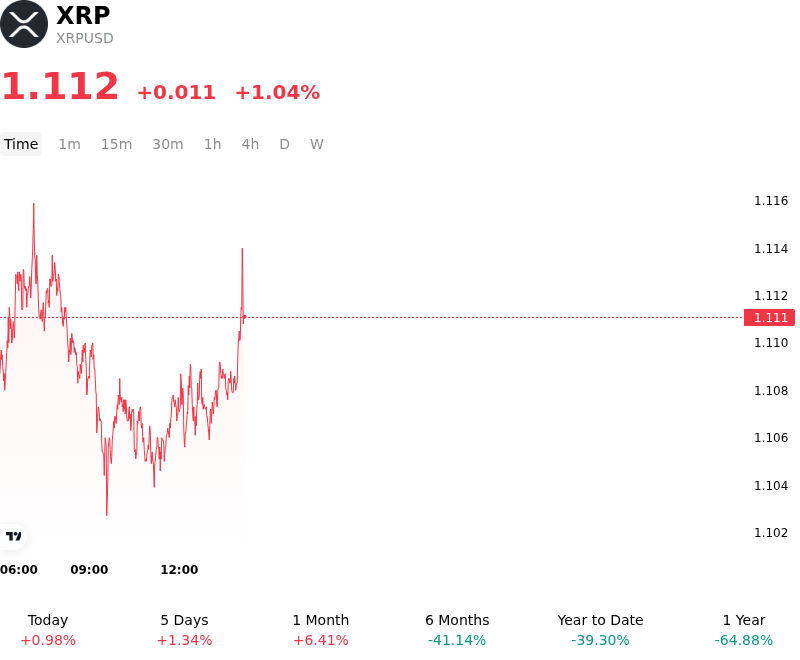
What is driving XRP (XRPUSD)’s stock price up today?
The appreciation in XRP is primarily attributed to a sustained uptick in institutional liquidity demands as the Ripple Payments network continues to integrate with regional banking infrastructures across Southeast Asia and the Middle East. Increased on-chain volume suggests that financial institutions are scaling their use of XRP as a bridge currency for real-time settlement, shifting the asset's valuation away from speculative retail interest toward fundamental utility-driven demand. This transition is supported by high-tier exchange liquidity, which remains robust following the full integration of XRP into institutional-grade custody platforms.
Market sentiment has also been bolstered by the continued stability of the regulatory landscape for digital assets in the United States. With the clarity established by historical legal resolutions, XRP is increasingly viewed as a compliance-centric asset suitable for diversified institutional portfolios. The anticipation of expanded spot ETF inflows—following recent filings and successful product launches by global asset managers—has created a supportive floor for price action. Investors appear to be repositioning for a surge in passive capital allocation, evidenced by the steady reduction in exchange-side supply as long-term holders move assets into institutional-grade cold storage.
From a macro perspective, the current movement aligns with a broader rotation into high-utility digital assets as global liquidity conditions stabilize. A slight moderation in the U.S. Dollar Index and stabilizing Treasury yields have improved the risk appetite for assets with clear commercial applications. Furthermore, derivatives market data indicates a healthy accumulation phase, with open interest growing alongside neutral to positive funding rates. This suggests that the current price strength is driven by spot accumulation and enterprise adoption rather than excessive speculative leverage, reinforcing XRP's position as a core component of the evolving cross-border payments ecosystem.
Technical Analysis of XRP (XRPUSD)
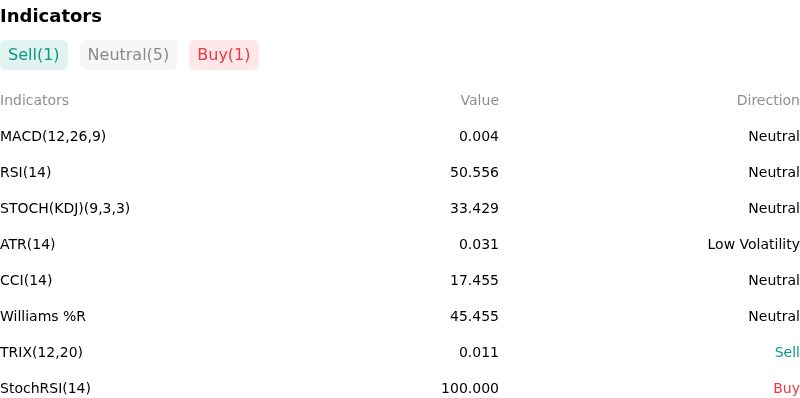
Technically, XRP (XRPUSD) shows a MACD (12,26,9) value of 0.004, indicating a neutral signal. The RSI at 50.556 suggests neutral condition and the Williams %R at 45.455 suggests neutral condition. Please monitor closely.
More details about XRP (XRPUSD)
Recent Events and Risks:
- Legal and Regulatory Overhang: The SEC’s pursuit of significant financial penalties and a permanent injunction against Ripple’s institutional XRP sales creates a persistent threat of adverse judicial rulings that could restrict the token’s core On-Demand Liquidity (ODL) functions and utility.
- Exchange Deposit Spikes: Recent on-chain data tracking indicates large-scale whale movements, characterized by the transfer of tens of millions of XRP to centralized trading platforms such as Bitstamp, suggesting an increase in near-term sell-side liquidity that could depress prices during low-volume sessions.
- Relative Market Underperformance: As institutional focus remains concentrated on Bitcoin and Ethereum following their respective ETF milestones, XRP faces capital flight and reduced demand, leading to intraday volatility as liquidity providers shift focus to assets with higher institutional narrative strength and regulatory tailwinds.
- Derivative Market Fragility: Elevated levels of long-side leverage in XRP perpetual contracts make the asset susceptible to rapid liquidation cascades if price action dips below critical psychological support levels, potentially accelerating downside momentum through forced automated selling.
Recommended Articles


