


EUR/GBP Price Forecast: In a positive trend with bulls eyeing 0.8555 resistance
- EUR/GBP dips found buyers at 0.8530, which keeps the 0.8555 high on the bulls' focus.
- A cease of hostilities in Iran and the decline in oil prices have given a fresh boost to the Euro.
- The Euro is on a bullish correction after a 2.5% sell-off from June's highs.
The Euro (EUR) has picked up towards the 0.8540 area against the British Pound (GBP) on Monday, after a mild pullback on Friday found support at 0.8530. The pair maintains the immediate bullish trend from mid-July lows at 0.8455, with bulls looking at three-week highs in the area of 0.8555.
The Euro is drawing support from a moderate relief rally on Monday, as the US and Iran halted their hostilities, which allowed Oil prices to decline about 9% from last week’s highs, with the barrel of Brent Oil down to $87.40 from above $96.00 last Thursday. Eurozone countries are net Oil importers, and the Crude rally seen over the last few weeks had threatened to strangle economic activity.
In the UK, Prime Minister Andrew Burnham’s spending plans keep investors on edge while the focus this week shifts to the Bank of England (BoE) monetary policy decision. The BoE will, all but certain, leave interest rates on hold, but investors will be very attentive to the vote split and Governor Bailey’s press release to assess the chances of any rate hike in the near-term.
Technical Analysis: In a bullish correction following the June-July sell-off
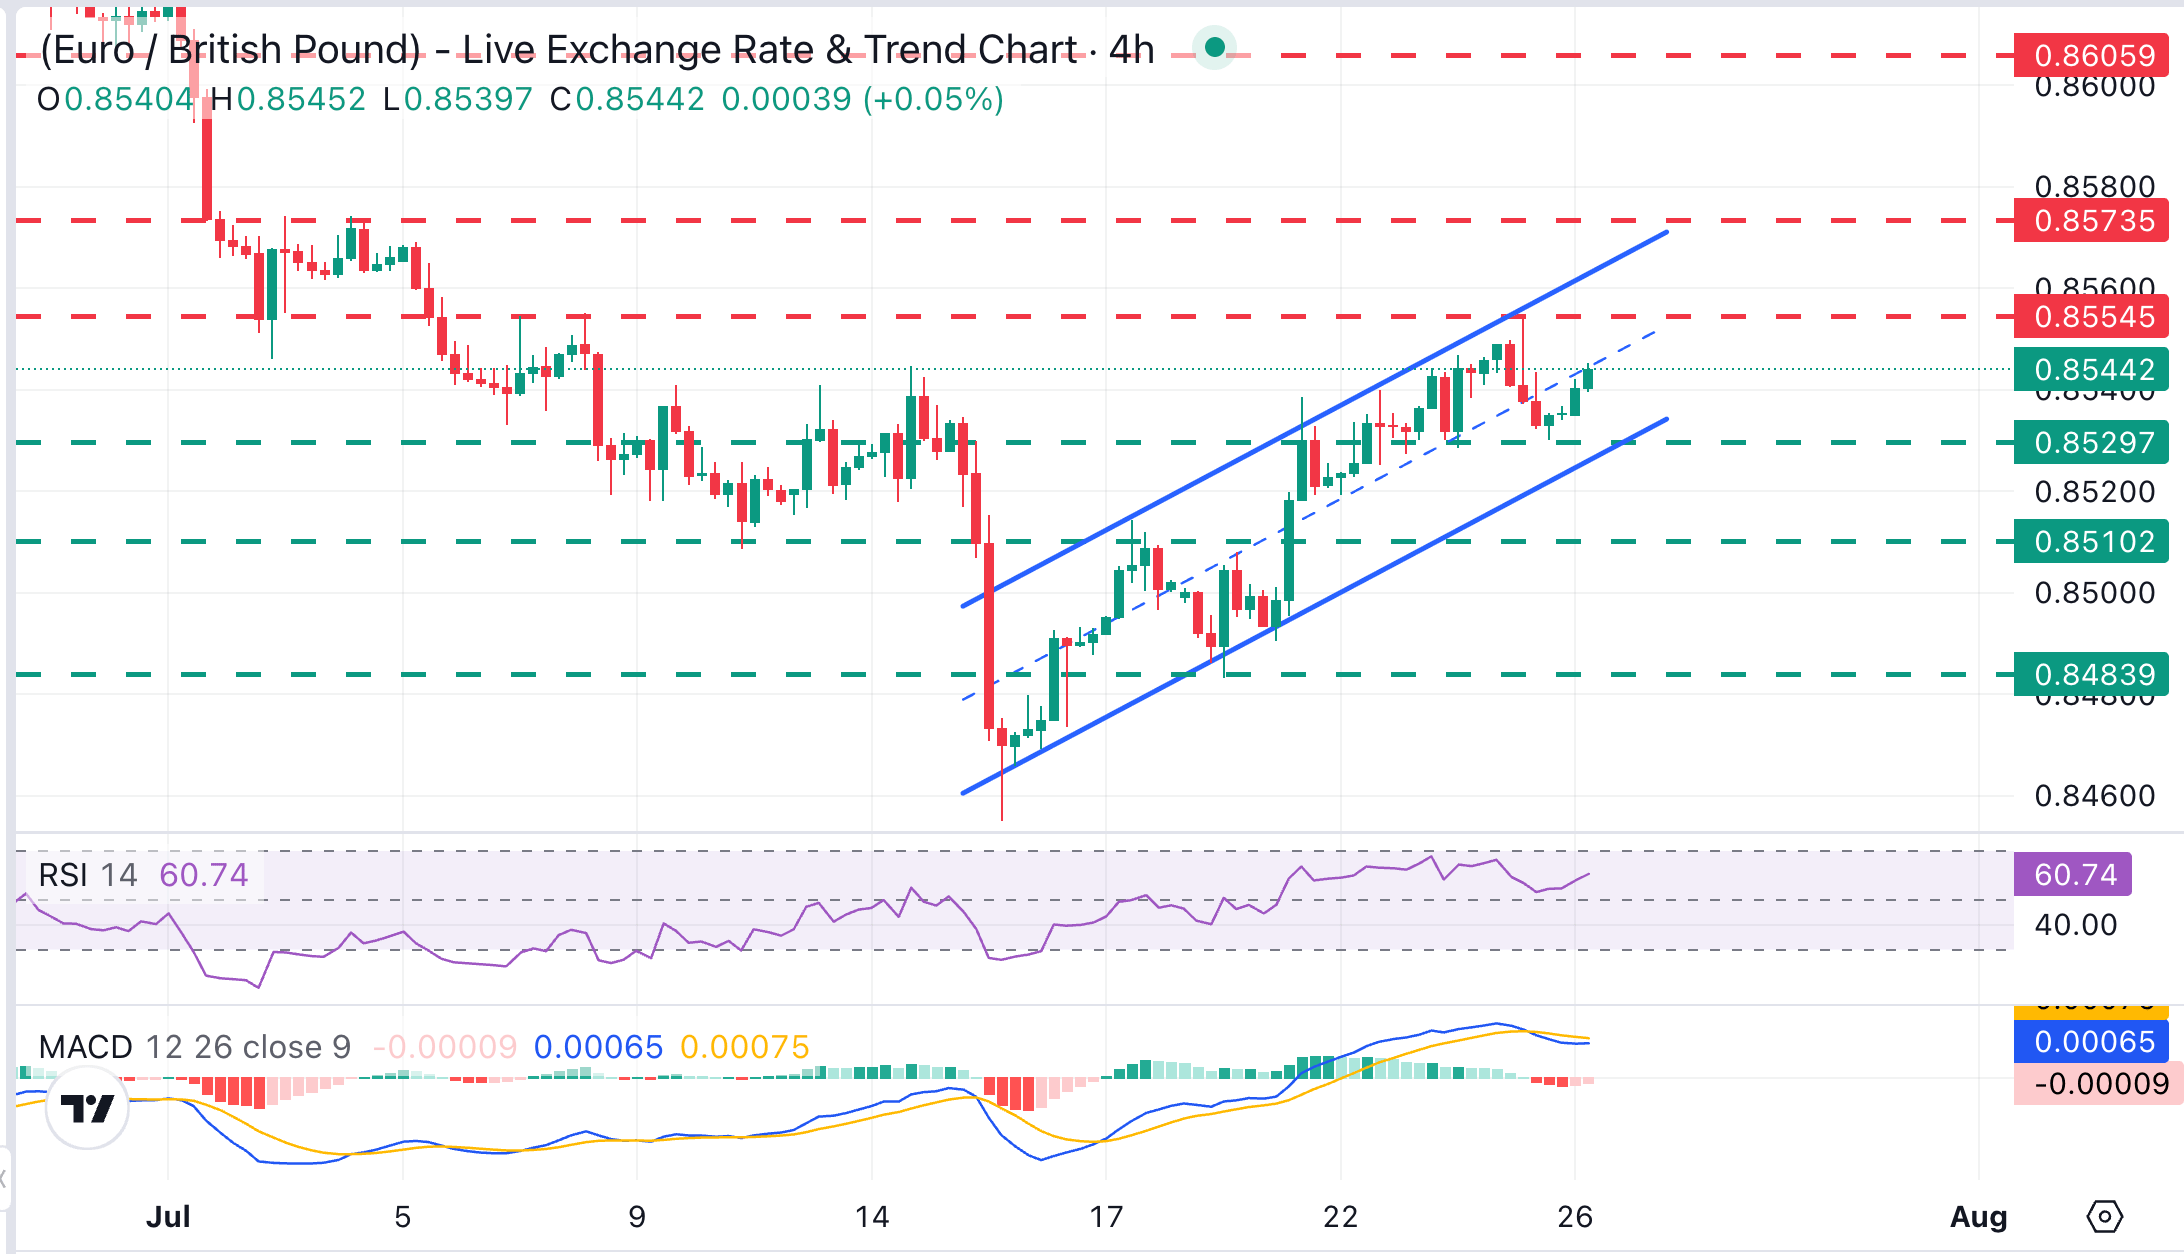
EUR/GBP trades at 0.8543, keeping a constructive near-term tone as it holds within a bullish channel from mid-July lows. The pair is correcting higher after a 2.5% decline from June highs, with momentum indicators hinting at a mild upside bias. The Relative Strength Index (14) is around 60, hinting at positive momentum, even as the MACD (12, 26, close, 9) has slipped marginally into negative territory.
The bullish structure maintains the July 8 and 24 highs at 0.8555 in play. Above that level, the top of the channel, now around 0.8565, and July 2 and 3 highs, in the area of 0.8575, are likely to test bulls.
On the downside, immediate support emerges at the confluence of the channel floor and July 23 and 24 lows, around 0.8530. Below here, a previous resistance area, around 0.8510 (July 17, 20 highs), is likely to be targeted ahead of the July 20 low, at 0.8483.
(The technical analysis of this story was written with the help of an AI tool. Know more.)
Euro Price Today
The table below shows the percentage change of Euro (EUR) against listed major currencies today. Euro was the strongest against the Canadian Dollar.
| USD | EUR | GBP | JPY | CAD | AUD | NZD | CHF | |
|---|---|---|---|---|---|---|---|---|
| USD | -0.34% | -0.20% | -0.18% | 0.03% | -0.32% | -0.24% | -0.44% | |
| EUR | 0.34% | 0.11% | 0.15% | 0.36% | 0.03% | 0.12% | -0.11% | |
| GBP | 0.20% | -0.11% | 0.04% | 0.25% | -0.10% | -0.03% | -0.22% | |
| JPY | 0.18% | -0.15% | -0.04% | 0.18% | -0.15% | -0.07% | -0.25% | |
| CAD | -0.03% | -0.36% | -0.25% | -0.18% | -0.34% | -0.26% | -0.46% | |
| AUD | 0.32% | -0.03% | 0.10% | 0.15% | 0.34% | 0.11% | -0.13% | |
| NZD | 0.24% | -0.12% | 0.03% | 0.07% | 0.26% | -0.11% | -0.23% | |
| CHF | 0.44% | 0.11% | 0.22% | 0.25% | 0.46% | 0.13% | 0.23% |
The heat map shows percentage changes of major currencies against each other. The base currency is picked from the left column, while the quote currency is picked from the top row. For example, if you pick the Euro from the left column and move along the horizontal line to the US Dollar, the percentage change displayed in the box will represent EUR (base)/USD (quote).
Recommended Articles


