


Silver/AUD (XAGAUD) Is up 2.51% on Jul 21: What You Need to Watch
Silver/AUD (XAGAUD) is up 2.51% at Jul 21 00:10(ET), now at $82.547, with a 7-day down of 1.83%.
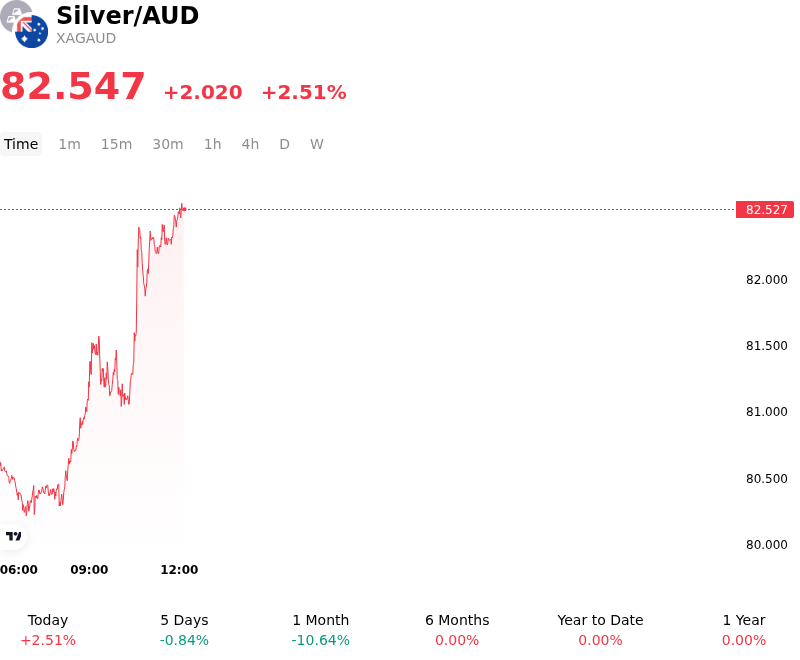
What is driving Silver/AUD (XAGAUD)’s stock price up today?
The advance in the silver-to-Australian dollar cross is primarily driven by a confluence of bullish momentum in the global silver market and idiosyncratic weakness in the Australian dollar. On the silver side, institutional demand has accelerated as market participants reposition for a lower interest rate environment globally. Since silver carries no yield, the decline in real sovereign bond yields across major economies has reduced the opportunity cost of holding the metal, attracting significant capital inflows from macro funds looking for inflation protection and capital appreciation.
Simultaneously, silver’s industrial profile remains a critical tailwind. Ongoing structural deficits in the silver market, underpinned by robust demand from the photovoltaic and electronics sectors, are creating a tightening supply-demand balance. With mining output in key regions facing operational headwinds and regulatory uncertainty, the market is pricing in a more constrained inventory outlook for the second half of the year. This supply-side pressure is magnifying the impact of any uptick in investment demand, as physical stockpiles in exchange-monitored warehouses continue to trend toward multi-year lows.
The Australian dollar's relative underperformance further amplifies the move in XAGAUD. The currency has faced downward pressure following recent domestic economic data that suggests a cooling labor market, leading investors to price in a more accommodative stance from the Reserve Bank of Australia. As the yield spread between Australian bonds and their global peers narrows, the Australian dollar loses its carry-trade appeal. Furthermore, softer-than-expected manufacturing data from major trading partners has dampened the outlook for Australia’s primary commodity exports, weighing heavily on the currency's valuation.
From a technical and positioning standpoint, the sharp move suggests a period of short-covering among institutional traders who had previously hedged against a stronger Australian dollar. As the cross broke through key resistance levels, automated liquidity-driven flows likely exacerbated the upward trajectory. Investors are now closely monitoring upcoming central bank communications for confirmation of a structural shift in monetary policy, which could provide further fuel for precious metals denominated in commodity-linked currencies if the divergence between precious metal demand and cyclical currency strength persists.
Technical Analysis of Silver/AUD (XAGAUD)
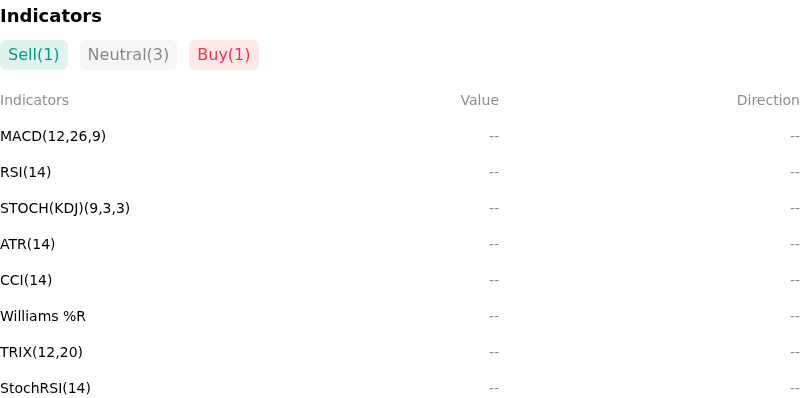
Technically, Silver/AUD (XAGAUD) shows a MACD (12,26,9) value of 0.000, indicating a neutral signal. The RSI at 37.822 suggests neutral condition and the Williams %R at 67.248 suggests sell condition. Please monitor closely.
More details about Silver/AUD (XAGAUD)
Recent Events and Risks:
- Softening Chinese Industrial Consumption: Recent manufacturing data from major Asian hubs indicates a contraction in electronics and photovoltaic production, silver's primary industrial drivers, leading to immediate concerns over a surplus in the physical market.
- RBA Hawkishness and AUD Appreciation: Unexpectedly sticky domestic inflation data has prompted the Reserve Bank of Australia to maintain a hawkish monetary stance, strengthening the AUD and putting direct downward pressure on the XAG/AUD cross-rate as the local currency outperforms the metal.
- U.S. Dollar Strength and Yield Pressure: A resurgence in the U.S. Dollar Index (DXY) following robust U.S. labor market updates has triggered a broad-based liquidation of precious metal long positions, causing silver to lose its appeal as a macro hedge.
- Rising Global Exchange Inventories: Latest warehouse reports from COMEX and LBMA show a notable increase in silver stocks over the last 72 hours, signaling high physical availability that discourages speculative buying and caps intraday price recovery.
Recommended Articles


