


Ethereum (ETHUSD) Is down 1.04% on Jul 17: Key Drivers to Watch
Ethereum (ETHUSD) is down 1.04% at Jul 17 00:00(ET), now at $1850.03, with a 7-day up of 3.49%.
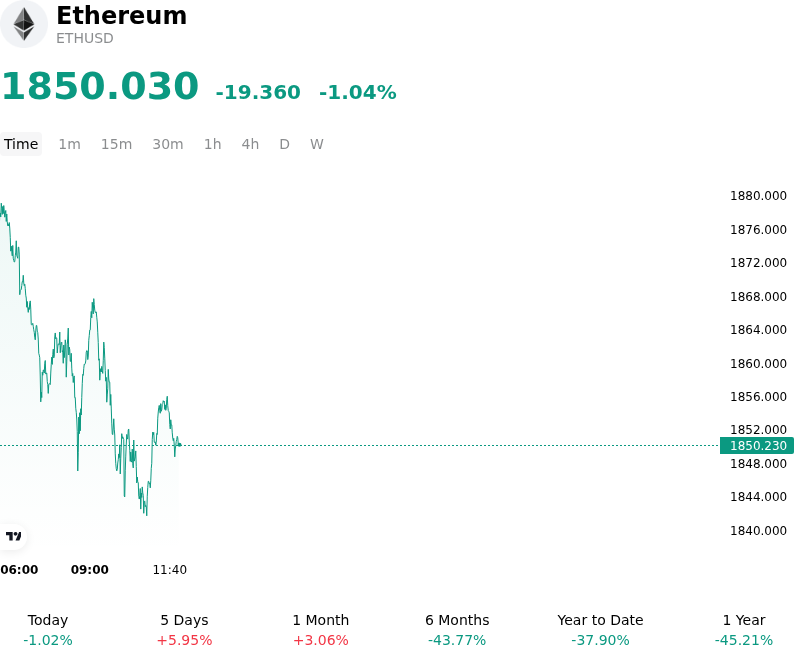
What is driving Ethereum (ETHUSD)’s stock price down today?
The current downward pressure on Ethereum reflects a broader repricing of risk assets as market participants react to a resilient US economic outlook and shifting expectations for Federal Reserve policy. The recent uptick in long-term Treasury yields has narrowed the spread between risk-free rates and Ethereum’s staking yield, prompting institutional investors to reduce exposure in favor of safer, high-yielding sovereign debt. This adjustment in capital allocation is particularly evident in the slowdown of net inflows into spot Ethereum exchange-traded funds, which had previously served as a primary source of price support.
Furthermore, liquidity conditions in the crypto-native derivatives market have contributed to the intraday weakness. A modest increase in sell-side pressure triggered a series of liquidations in leveraged long positions across major exchanges, creating a localized liquidity vacuum. While on-chain fundamentals remain stable, the immediate market sentiment has been dampened by a rotation of capital toward Bitcoin and other large-cap digital assets that are currently perceived as better hedges against persistent inflationary pressures.
On-chain activity also reveals a slight decrease in network fee generation, as transaction volume shifts increasingly toward Layer-2 scaling solutions. This migration, while beneficial for long-term scalability, has temporarily reduced the burn rate of the circulating supply, easing the deflationary pressure that typically supports the asset's valuation during periods of high demand. Consequently, investors are adopting a more cautious stance, monitoring whether current support levels can withstand the ongoing rebalancing of institutional portfolios.
Regulatory clarity remains a secondary but persistent factor, as market participants await further guidance on the treatment of secondary market staking services. Any perceived increase in regulatory scrutiny on decentralized finance protocols tends to weigh on Ethereum’s growth expectations, given its role as the foundational layer for the ecosystem. For now, the price action suggests a period of consolidation as the market searches for a fresh catalyst to re-engage sidelined capital.
Technical Analysis of Ethereum (ETHUSD)
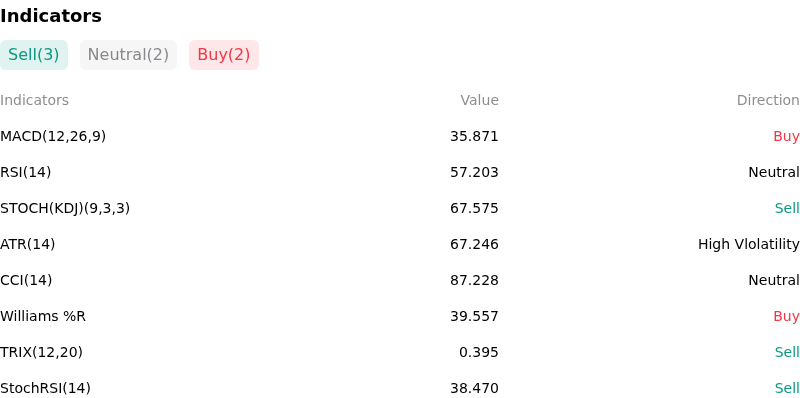
Technically, Ethereum (ETHUSD) shows a MACD (12,26,9) value of 35.871, indicating a buy signal. The RSI at 57.203 suggests neutral condition and the Williams %R at 39.557 suggests buy condition. Please monitor closely.
More details about Ethereum (ETHUSD)
Recent Events and Risks:
- Institutional Outflow Pressure: Recent data for spot Ethereum ETFs shows a trend of net outflows or stagnating inflows, particularly driven by continued liquidations from higher-fee incumbent products, which has dampened market expectations for sustained institutional buy-side support.
- Whale Exchange Inflow Spikes: On-chain monitoring has identified significant transfers of ETH from large, long-term holding wallets to centralized exchanges over the past 48 hours, suggesting a heightening risk of spot selling pressure and profit-taking by major stakeholders.
- Leverage and Liquidation Clusters: The presence of dense long-side liquidation clusters just below current price levels, combined with a rise in open interest, creates a risk of a cascading "long squeeze" if psychological support levels are breached, potentially accelerating intraday downside.
- Macro-Driven Capital Flight: A strengthening U.S. Dollar Index (DXY) and rising Treasury yields have renewed downward pressure on high-beta digital assets, as investors shift toward defensive positioning and risk-off sentiment in response to persistent inflation concerns and global liquidity tightening.
Recommended Articles


