


WTI Futures (USOIL-F) Is up 3.96% on Jul 13: What Changed in Supply and Demand?
WTI Futures (USOIL-F) is up 3.96% at Jul 13 00:15(ET), now at $74.27, with a 7-day up of 8.36%.
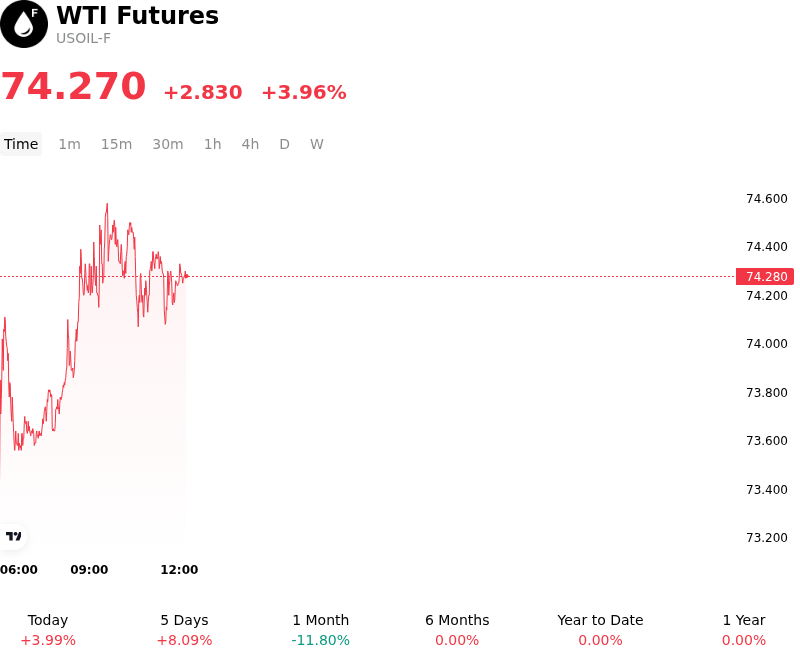
What is driving WTI Futures (USOIL-F)’s stock price up today?
The rally in WTI crude oil is primarily driven by a sharp escalation in geopolitical risks in the Middle East, which has reignited concerns over potential supply disruptions through critical transit corridors. Reports of increased friction near the Strait of Hormuz have prompted institutional investors to re-establish risk premiums, fearing that any physical impairment to crude flows would tighten a global market already grappling with thin spare capacity. This geopolitical flare-up has shifted the market narrative from demand-side concerns back to the fragility of global supply chains.
Simultaneously, the market is reacting to internal signals from the OPEC+ coalition suggesting that the current voluntary production cuts will remain in place longer than previously anticipated. The alliance appears committed to maintaining a price floor in the face of fluctuating macroeconomic indicators, effectively reducing the likelihood of a supply surplus in the second half of the year. This supply-side discipline, combined with the seasonal peak in summer transport fuel demand, is creating a tighter physical market balance that supports higher valuations.
Macroeconomic tailwinds are further amplifying the upward pressure on prices. A weakening US dollar, triggered by cooling inflation data and growing expectations for a more accommodative Federal Reserve policy, has made dollar-denominated commodities more attractive to international buyers. As real yields soften, institutional capital flows are rotating back into the energy complex, with systematic trend-followers and hedge funds liquidating short positions and initiating fresh longs.
From a technical perspective, the breach of key resistance levels has triggered a wave of algorithmic buying and short-covering. This shift in positioning reflects a broader structural change in sentiment as the market transitions from a defensive stance to one focused on supply scarcity. While investors continue to monitor long-term manufacturing activity in major importing regions, the immediate focus remains on the risk of a supply-side shock and the impact of a more favorable interest rate environment on global energy consumption.
More details about WTI Futures (USOIL-F)
Recent Events and Risks:
- Unexpected Domestic Inventory Build: The latest EIA Weekly Petroleum Status Report revealed a 5.5 million barrel increase in U.S. commercial crude inventories, significantly higher than the forecasted 270,000-barrel build, indicating a loosening of near-term physical market conditions.
- Erosion of Geopolitical Risk Premium: Market volatility is trending downward as diplomatic efforts intensify in the Middle East, with traders liquidating long positions following reports that potential retaliatory actions may avoid energy infrastructure, thereby deflating the supply-disruption premium.
- Weakening Chinese Refinery Demand: Persistent weakness in Chinese industrial data and refinery throughput rates suggests that the world's largest importer is struggling with high inventory levels and low margins, failing to provide the anticipated demand floor despite recent government stimulus announcements.
- Macroeconomic Pressure from US Dollar Strength: The US Dollar Index has reached multi-month highs, driven by expectations of a slower pace of interest rate cuts, which increases the cost of crude for international buyers and exerts significant downward pressure on dollar-denominated commodity futures.
Recommended Articles


