


Solana (SOLUSD) Suddenly Goes down 1.98% on Jul 13: What You Need to Watch
Solana (SOLUSD) is down 1.98% at Jul 13 00:15(ET), now at $74.95, with a 7-day down of 7.58%.
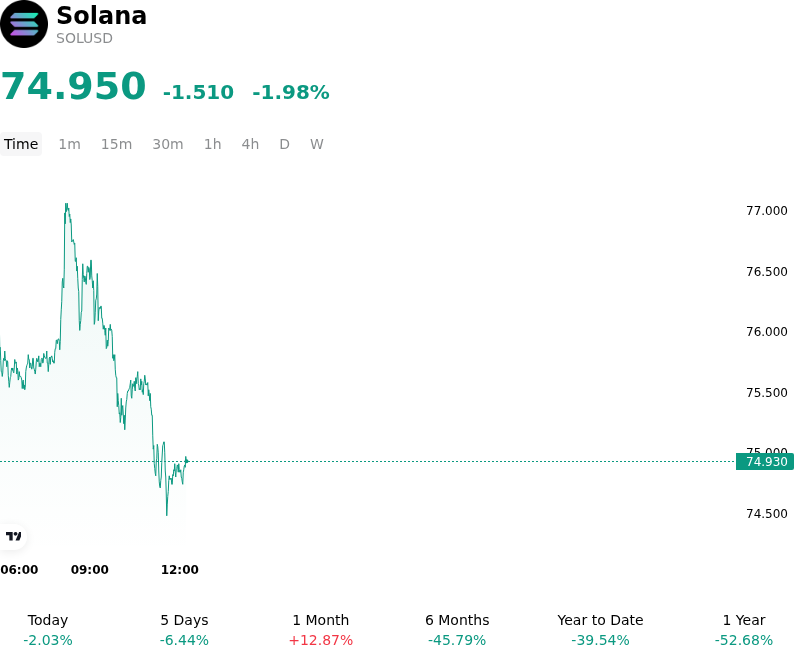
What is driving Solana (SOLUSD)’s stock price down today?
The decline in Solana during today's session primarily reflects a broader risk-off sentiment across the digital asset market, catalyzed by a recalibration of global liquidity expectations. As Treasury yields pushed higher in response to resilient economic data, the opportunity cost of holding non-yielding assets increased, prompting institutional desks to reduce exposure to high-beta Layer-1 protocols. This macro-driven rotation was particularly evident in the Solana ecosystem, which maintains a higher volatility profile relative to Bitcoin and Ethereum, making it more sensitive to shifts in the discount rate and dollar strength.
Institutional demand through spot Solana ETFs appears to have reached a localized saturation point, with daily net flows showing signs of exhaustion after a period of sustained accumulation. This shift in capital flow dynamics suggests that the aggressive entry of traditional finance participants is transitioning into a phase of portfolio rebalancing. Furthermore, a minor deceleration in on-chain decentralized exchange volumes and a cooling of speculative activity within Solana-based decentralized physical infrastructure networks and digital collectibles have reduced the immediate organic demand for SOL as a utility asset for transaction fees and collateral.
The technical structure of the market was further pressured by a flush of long-leveraged positions in the derivatives market. As the price moved toward key intraday liquidity clusters, a modest cascade of liquidations accelerated the downward move, a frequent occurrence when momentum-driven traders are over-positioned in a high-velocity environment. Despite the underlying network fundamentals and developer activity remaining robust, the lack of an immediate bullish catalyst left the asset vulnerable to the prevailing firming of interest rate expectations.
Regulatory considerations also remain a significant background factor as market participants monitor the evolving landscape for smart contract platforms. While institutional adoption has trended upward structurally, short-term price action remains sensitive to the perceived risk of regulatory friction and the implications of cross-border capital controls. Investors are currently prioritizing liquidity and defensive positioning until clearer signals emerge from the upcoming Federal Reserve communications and global inflation data prints.
Technical Analysis of Solana (SOLUSD)
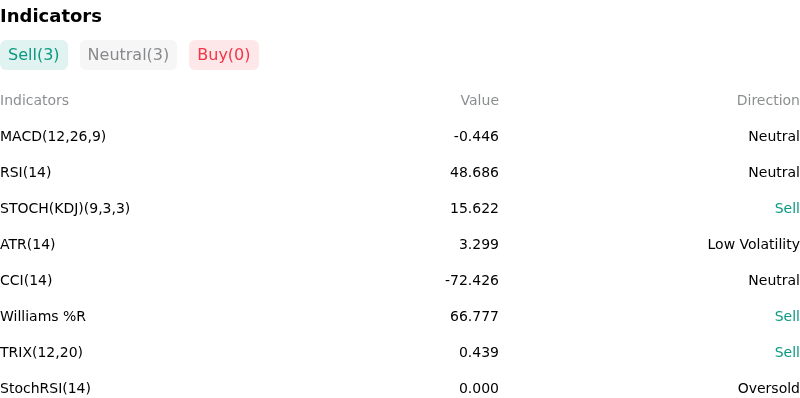
Technically, Solana (SOLUSD) shows a MACD (12,26,9) value of -0.446, indicating a neutral signal. The RSI at 48.686 suggests neutral condition and the Williams %R at 66.777 suggests sell condition. Please monitor closely.
More details about Solana (SOLUSD)
Recent Events and Risks:
- Regulatory Classification Uncertainty: Continued litigation by the SEC against major trading platforms maintains the classification of SOL as an unregistered security, posing a constant risk of localized delistings and restricted institutional access within the United States.
- Institutional Liquidation Overhang: On-chain monitoring of wallets linked to the FTX/Alameda bankruptcy estate indicates periodic transfers to centralized exchanges, creating significant sell-side pressure and overhead supply that can trigger sharp price retracements.
- Leverage and Funding Rate Imbalances: A concentrated buildup of long-biased open interest in the perpetual futures market has pushed funding rates to extreme levels, leaving the asset vulnerable to a "long squeeze" and rapid liquidation cascades if immediate support levels are breached.
- ETF Approval Skepticism: Market sentiment has cooled following analyst reports highlighting the lack of a regulated futures market for Solana, which significantly decreases the probability of a Spot Solana ETF approval in the near term compared to its larger peers, leading to a rotation of institutional capital.
Recommended Articles


