


Brent Futures (UKOIL-F) Surges on Jul 13: What Lie behind the Move?
Brent Futures (UKOIL-F) is up 4.09% at Jul 13 00:05(ET), now at $79.08, with a 7-day up of 9.94%.
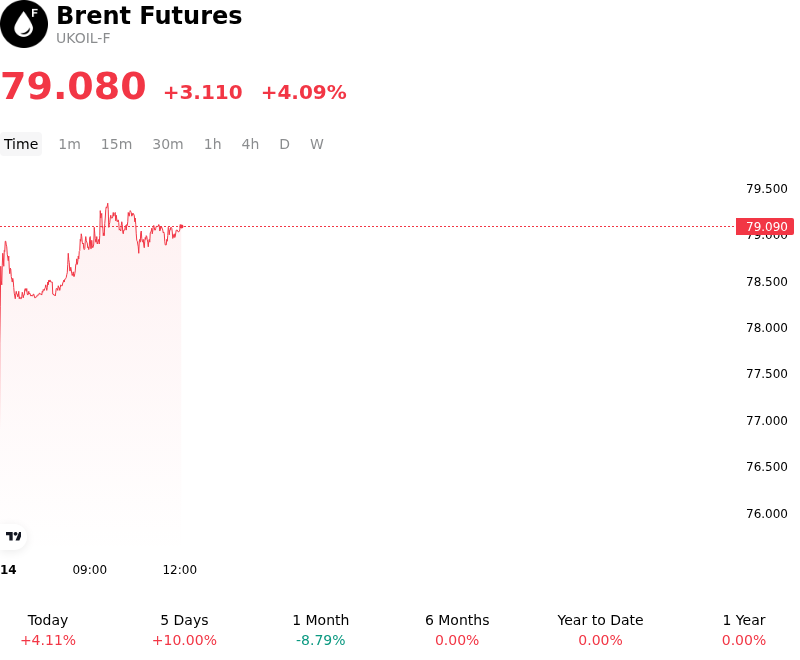
What is driving Brent Futures (UKOIL-F)’s stock price up today?
Brent crude prices surged today as escalating geopolitical risks in the Middle East significantly tightened the risk premium. Reports of a direct military confrontation involving key energy infrastructure near the Strait of Hormuz have raised immediate concerns regarding the security of maritime transit for nearly a fifth of global oil consumption. Institutional investors are rapidly pricing in the possibility of a prolonged disruption, leading to a sharp repricing of the supply-side risk buffer.
Compounding the supply concerns, signals from OPEC+ suggest that the alliance is prepared to defer the phase-in of voluntary production cuts previously scheduled for the coming months. The market is interpreting this as a commitment to maintaining market balance in the face of geopolitical uncertainty, effectively removing the threat of near-term oversupply. This shift in expectations has forced a significant liquidation of short positions by systematic trend-followers and hedge funds, providing additional momentum to the upside.
On the demand front, stronger-than-expected manufacturing data from major Asian economies has improved the outlook for industrial fuel consumption. The recent stabilization of global inflation has led to increased speculation that the Federal Reserve will maintain a more accommodative stance, further supporting global growth prospects. A weaker US dollar, reacting to these shifting interest rate expectations, provided additional tailwinds for Brent as the commodity becomes more affordable for international buyers.
Inventory data also continues to reflect a tightening physical market. Preliminary reports indicate a larger-than-anticipated drawdown in commercial crude stocks at key global hubs, suggesting that refinery runs remain high to meet peak seasonal demand. The convergence of these factors indicates that the price action reflects a structural reaction to a thinning global supply-demand balance and a heightened geopolitical risk environment, rather than a mere technical correction.
Investors remain focused on the potential for further escalations in energy-producing regions and the upcoming official inventory reports to confirm the extent of physical market tightness. While the current move is driven by immediate supply-side shocks, the broader structural trend is being reinforced by a resilient demand outlook and proactive supply management from the OPEC+ coalition.
More details about Brent Futures (UKOIL-F)
Recent Events and Risks:
- Chinese Demand Deterioration: Recent data indicating a contraction in manufacturing activity and lower-than-expected refinery runs in China have intensified concerns that the world's largest importer is facing structural demand weakness.
- OPEC+ Supply Phase-Out: Persistent market skepticism regarding the planned unwinding of voluntary production cuts later this year is creating a bearish overhang, as traders fear a return of significant barrels to a fragile global market.
- High US Gasoline Inventories: Weekly reports showing unexpected builds in US gasoline and crude stocks during the height of the summer driving season suggest that consumption is failing to keep pace with high domestic production levels.
- Macroeconomic Headwinds: Sustained strength in the US Dollar and signals of prolonged high interest rates are dampening global growth prospects and increasing the cost of crude for international buyers, leading to speculative selling.
Recommended Articles


