


Brent (UKOIL) Is up 4.06% on Jul 13: Is the Market Repricing It?
Brent (UKOIL) is up 4.06% at Jul 13 00:00(ET), now at $79.14, with a 7-day up of 9.84%.
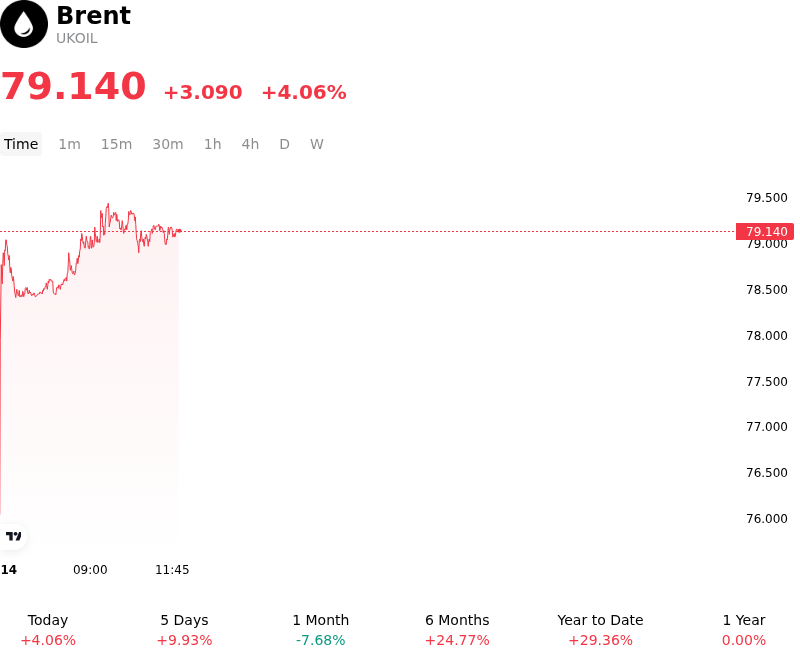
What is driving Brent (UKOIL)’s stock price up today?
The upward trajectory in Brent crude prices is primarily driven by a sharp escalation in geopolitical tensions within the Middle East, specifically concerning a credible threat to maritime security in the Strait of Hormuz. Reports of increased naval activity and potential interference with tanker traffic have immediately injected a significant risk premium into global oil benchmarks. Given that approximately one-fifth of the world's daily oil consumption passes through this chokepoint, market participants are pricing in a high probability of localized supply disruptions, shifting the focus from macroeconomic headwinds to immediate physical availability.
Complementing the geopolitical risk is a sudden and unplanned production outage in North Africa. Technical failures at several major export terminals have reportedly halted significant volumes of light sweet crude, further tightening a market that was already navigating a deficit. With OPEC+ maintaining its disciplined production stance and signaling no immediate intention to release spare capacity, the loss of these volumes has left refiners scrambling for prompt-loading cargoes, particularly in the Mediterranean and European markets where Brent-linked grades are the primary benchmark.
From a demand perspective, the rally is supported by stronger-than-expected seasonal consumption figures during the peak Northern Hemisphere summer driving period. Recent data suggests that gasoline and jet fuel demand have reached multi-year highs, drawing down commercial inventories at a faster rate than historical averages. This inventory depletion provides a bullish backdrop, making the price more sensitive to any supply-side shocks. Additionally, a softening of the US dollar following dovish commentary from Federal Reserve officials has lowered the cost of dollar-denominated commodities for international buyers, providing further upward momentum.
Institutional positioning has also played a role in accelerating the move. Trend-following funds and algorithmic traders, who had previously maintained cautious positions, were forced to cover shorts as key technical resistance levels were breached. This influx of capital has amplified the price response to the fundamental supply disruptions. While the move is largely event-driven, the underlying structural tightness and the inability of non-OPEC production to bridge the gap in the short term suggest that the market balance remains fragile, with investors now closely monitoring shipping data for signs of prolonged transit delays.
Technical Analysis of Brent (UKOIL)
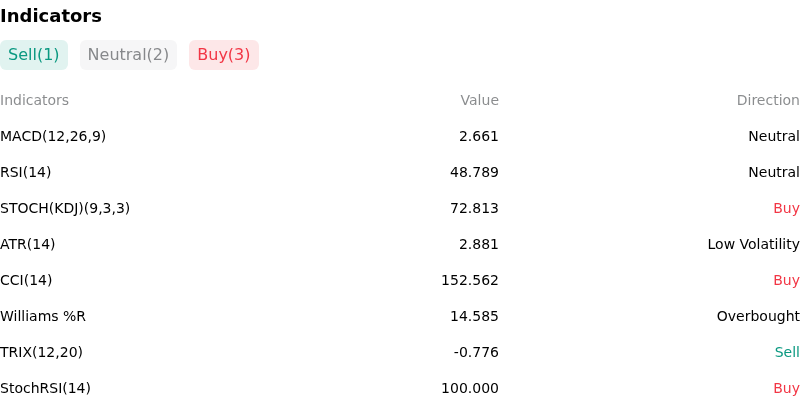
Technically, Brent (UKOIL) shows a MACD (12,26,9) value of 2.661, indicating a neutral signal. The RSI at 48.789 suggests neutral condition and the Williams %R at 14.585 suggests overbought condition. Please monitor closely.
More details about Brent (UKOIL)
Recent Events and Risks:
- Chinese Demand Deterioration: Recent economic indicators from China, including softening refinery throughput and weak manufacturing PMI data over the last 72 hours, have heightened fears that industrial demand in the world's largest crude importer is stalling, creating significant intraday selling pressure.
- U.S. Inventory Builds and Record Output: Latest industry reports showing unexpected builds in domestic gasoline and distillate stocks, coupled with U.S. crude production maintaining record levels near 13.3 million barrels per day, are signaling a loosening physical market and weighing on Brent’s prompt-month spread.
- Erosion of Geopolitical Risk Premium: Market participants are aggressively unwinding long positions as the lack of fresh escalations in the Middle East and reports of ongoing diplomatic efforts lead to a reduction in the "war premium" previously priced into the futures curve.
- Monetary Policy Uncertainty and Dollar Strength: Hawkish signals from central bank officials suggesting "higher-for-longer" interest rates have bolstered the U.S. Dollar, making Brent crude more expensive for international buyers and triggering macro-driven liquidations in risk-linked commodity baskets.
Recommended Articles


