


Ethereum (ETHUSD) Suddenly Goes down 1.22% on Jul 7: What You Need to Watch
Ethereum (ETHUSD) is down 1.22% at Jul 7 00:15(ET), now at $1768.76, with a 7-day up of 12.41%.
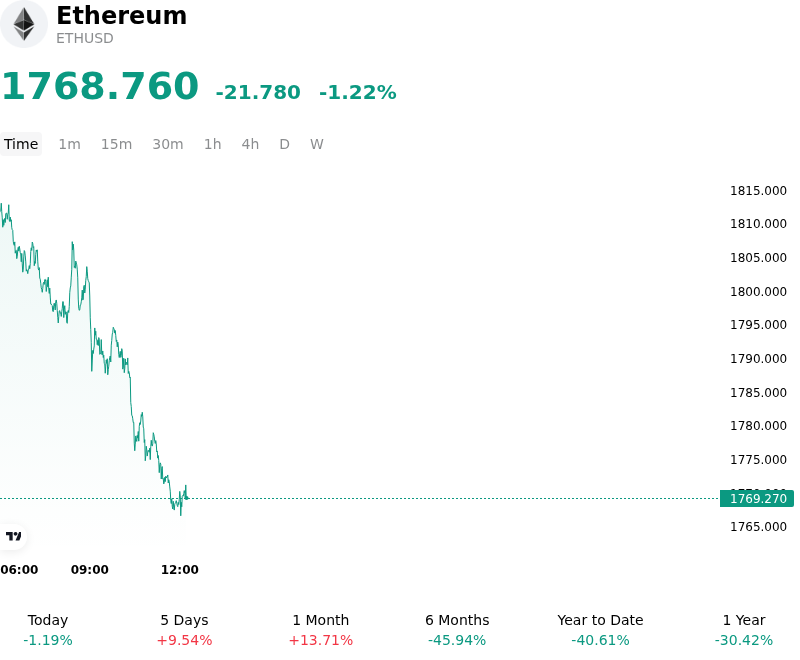
What is driving Ethereum (ETHUSD)’s stock price down today?
The downward intraday movement in Ethereum reflects a temporary pause and minor correction following a swift recovery earlier in the week, driven primarily by technical resistance and cooling derivatives momentum. After rallying on the back of weaker-than-expected United States labor market data, which had bolstered expectations for a Federal Reserve rate-cut cycle, Ethereum faced formidable horizontal resistance. This technical ceiling, situated around the psychological and structural level, triggered profit-taking and localized liquidations among short-term long positions.
From a broader structural perspective, institutional demand continues to show signs of stabilization despite the immediate intraday pullback. The market has recently seen positive developments, such as the cessation of prolonged outflow streaks from spot Ethereum exchange-traded funds (ETFs) and ongoing large-scale treasury accumulations by corporate entities. These factors have helped establish a stronger demand floor. However, the immediate absence of a fresh macroeconomic catalyst or decisive regulatory breakthrough has prevented a sustained breakout, leaving the asset vulnerable to technical rejection at key moving averages.
Derivatives positioning further explains the intraday volatility, as funding rates and momentum indicators such as the hourly MACD printed bearish crossovers, indicating that immediate buying pressure had temporarily exhausted. This cooling-off period is typical after sharp double-digit percentage gains over several sessions, representing a standard consolidation phase rather than a fundamental breakdown.
Investors continue to monitor key macroeconomic risks, particularly upcoming monetary policy guidance and inflation data, which could rapidly alter global liquidity conditions and capital flows. Additionally, the long-term outlook remains tied to the potential approval and development of staking-yield-bearing ETFs. Until these structural drivers achieve greater clarity, Ethereum is expected to experience continued intraday volatility as it consolidates within its established trading range.
Technical Analysis of Ethereum (ETHUSD)
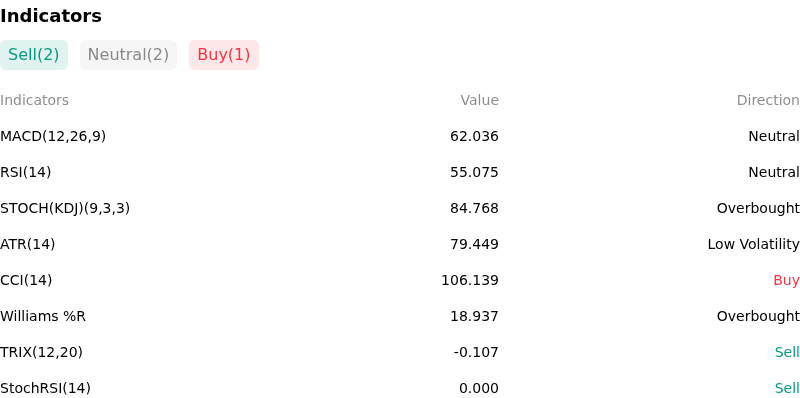
Technically, Ethereum (ETHUSD) shows a MACD (12,26,9) value of 62.057, indicating a neutral signal. The RSI at 55.093 suggests neutral condition and the Williams %R at 18.887 suggests overbought condition. Please monitor closely.
More details about Ethereum (ETHUSD)
Recent Events and Risks:
- Persistent ETF Capital Outflows: U.S. spot Ethereum ETFs registered a net capital outflow of $13.67 million for the weekly trading session ending July 3, 2026, marking their eighth consecutive week of net negative flows. This sustained lack of institutional demand continues to weaken the underlying spot bid and exposes the asset to persistent sell-side pressure.
- Severe Decay in On-Chain Engagement: Organic network utility on the Ethereum mainnet remains severely depressed, with active addresses collapsing by roughly 46% from their early 2026 peak of 795,000 down to a 14-day average of approximately 420,000. This drop in transaction demand has significantly lowered on-chain fee generation, undermining the deflationary burn mechanism and shifting ETH's supply dynamics toward an inflationary model.
- Sustained Technical and Structural Weakness: After closing three consecutive quarters in the red for the first time in its history—shedding over 60% of its value since late 2025—ETHUSD continues to trade below all major daily exponential moving averages (the 20-day, 50-day, and 200-day EMAs). Furthermore, a confirmed "death cross" on technical charts has heightened fears of a breakdown below the critical $1,500 support toward the $1,275 or $1,000 psychological zones.
- Skewed Derivatives Leverage and Liquidation Risks: Despite sliding spot prices, retail traders maintain highly leveraged long biases, driving the ETH/USDT long-short account ratio past 2.3 on major exchanges like Binance. This concentration of heavily leveraged spot long positions has left the market highly vulnerable to sudden, localized liquidation cascades if downward price pressure accelerates.
Recommended Articles


