


USD/JPY (USDJPY) Surges 0.53% on Jul 6: What You Need to Watch
USD/JPY (USDJPY) is up 0.53% at Jul 6 02:20(ET), now at $162.196, with a 7-day up of 0.17%.
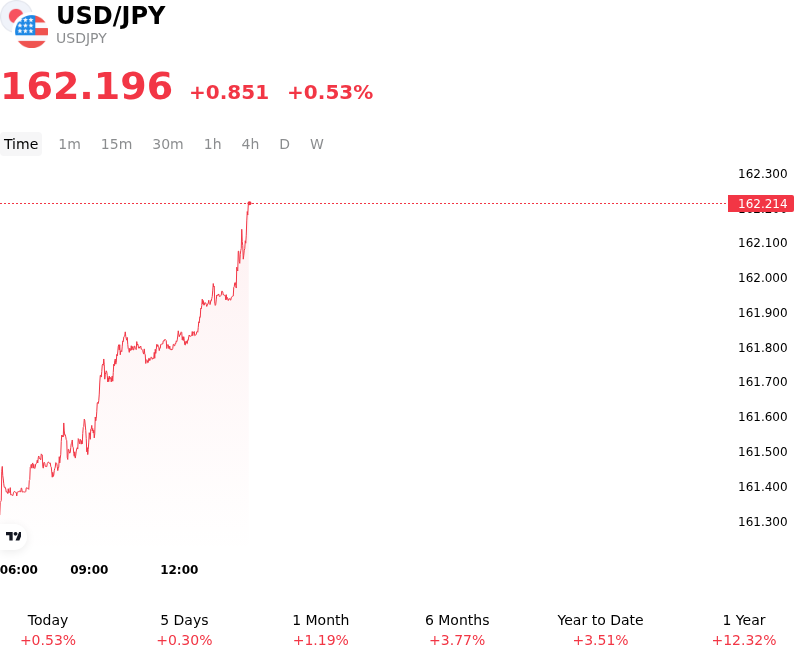
What is driving USD/JPY (USDJPY)’s stock price up today?
The upward movement in the USDJPY currency pair was primarily driven by the reversal of safe-haven flows and a tactical reassessment of currency intervention risks after the Japanese government chose to hold its fire.
In the preceding sessions, the Japanese yen had experienced a sharp, sudden surge, fueled by aggressive speculation that Tokyo was preparing a major currency intervention to protect the yen near 40-year lows. Because this initial surge occurred amid thin holiday liquidity surrounding the US Independence Day weekend, market participants were on high alert for sudden, unannounced actions by Japanese monetary officials. However, when the trading week opened and no direct official intervention materialized, the immediate fear faded, prompting institutional investors to unwind their protective yen positions and drive the currency pair back up.
Despite verbal warnings from Japanese officials that they remained ready to act to stabilize the currency, investors quickly returned to the dominant macroeconomic theme: the persistent interest-rate differential between the United States and Japan. The wide gap in government bond yields continues to favor the greenback, keeping the underlying pressure firmly against the yen.
While recent US economic data, including a softer-than-expected labor market report, had temporarily weighed on the dollar, the greenback firmed broadly as investors recalibrated their portfolios. Without a concrete policy shift or actual market operations from the Bank of Japan, traders remain highly motivated to exploit carry-trade strategies. Speculative capital flows consequently rotated back into the dollar, while the lack of hawkish follow-through from Japanese policymakers left the quote currency highly vulnerable.
Looking forward, institutional investors continue to monitor the tension between the Bank of Japan's potential tightening path and the ongoing risk of direct intervention. However, in the absence of tangible central bank action, market participants have shown a clear preference for returning to the yield-driven uptrend in the currency pair.
Technical Analysis of USD/JPY (USDJPY)
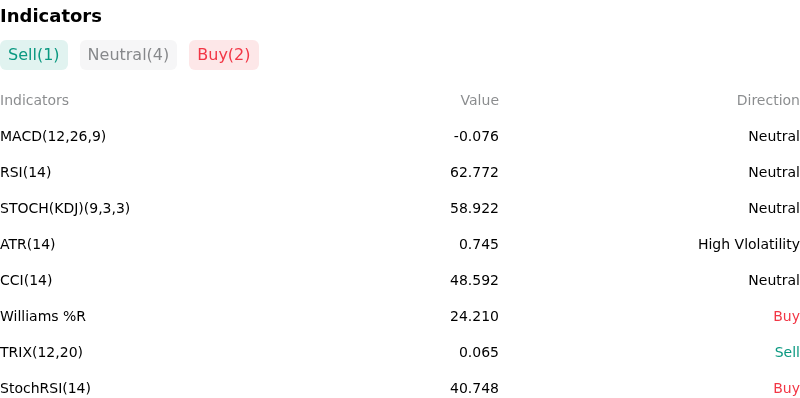
Technically, USD/JPY (USDJPY) shows a MACD (12,26,9) value of -0.076, indicating a neutral signal. The RSI at 62.772 suggests neutral condition and the Williams %R at 24.210 suggests buy condition. Please monitor closely.
More details about USD/JPY (USDJPY)
Recent Events and Risks:
- Unannounced and Stealth BOJ Intervention Tactics: Following a sudden drop in USD/JPY below 161 at the end of last week, reports indicate Japanese authorities are pivoting away from issuing explicit, verbal warnings. This strategic shift aims to keep markets off-balance by utilizing unannounced, stealth interventions to catch leveraged speculators off-guard and maximize the downside impact on the pair.
- Extreme Short-Yen Position Unwind: Speculative and hedge fund short positions on the Japanese Yen are bordering on historic extremes. This highly crowded positioning creates an elevated risk of a violent, cascading short-squeeze that would trigger rapid, involuntary unwinding of yen-funded carry trades and send USD/JPY sharply lower.
- Macro Catalyst Downturn and Softening US Yields: Following a softer-than-expected US Nonfarm Payrolls (NFP) report last week, market participants are highly sensitive to incoming US macro data, including the upcoming ISM Services PMI and inflation prints. Any further evidence of a cooling US economy could trigger a sharp contraction in US Treasury yields, rapidly narrowing the yield spread and dragging USD/JPY down from its multi-decade highs.
- Hawkish Pivot Commitments by the Bank of Japan: Although the BOJ raised its policy rate to 1.00%, persistent domestic inflation—with factory gate prices rising above 6%—maintains intense pressure on the central bank to aggressively advance its policy normalization. Stronger wage growth data and unexpected hawkish signals from upcoming BOJ communications could spark sudden, sharp downside moves in USD/JPY.
Recommended Articles


