

Japan and South Korea Stocks Turn From Gains to Losses: SK Hynix, SoftBank, and Kioxia All Fall, With Samsung Alone Defying the Trend to Support the Market

Source Tradingkey

TradingKey - Japanese and Korean stock markets turned from gains to losses, with SK Hynix, Kioxia, and SoftBank falling collectively, while Samsung alone bucked the trend to rise.

During the Asian trading session on July 6, Japanese and Korean stock markets opened higher but moved lower, ultimately closing with slight losses. Among them, the KOSPI index rose nearly 3% at one point in early trading before finally closing down 0.41% at 8,051.34 points; the Nikkei 225 index fell 0.01%, losing the 70,000-point mark to close at 69,737.47 points.
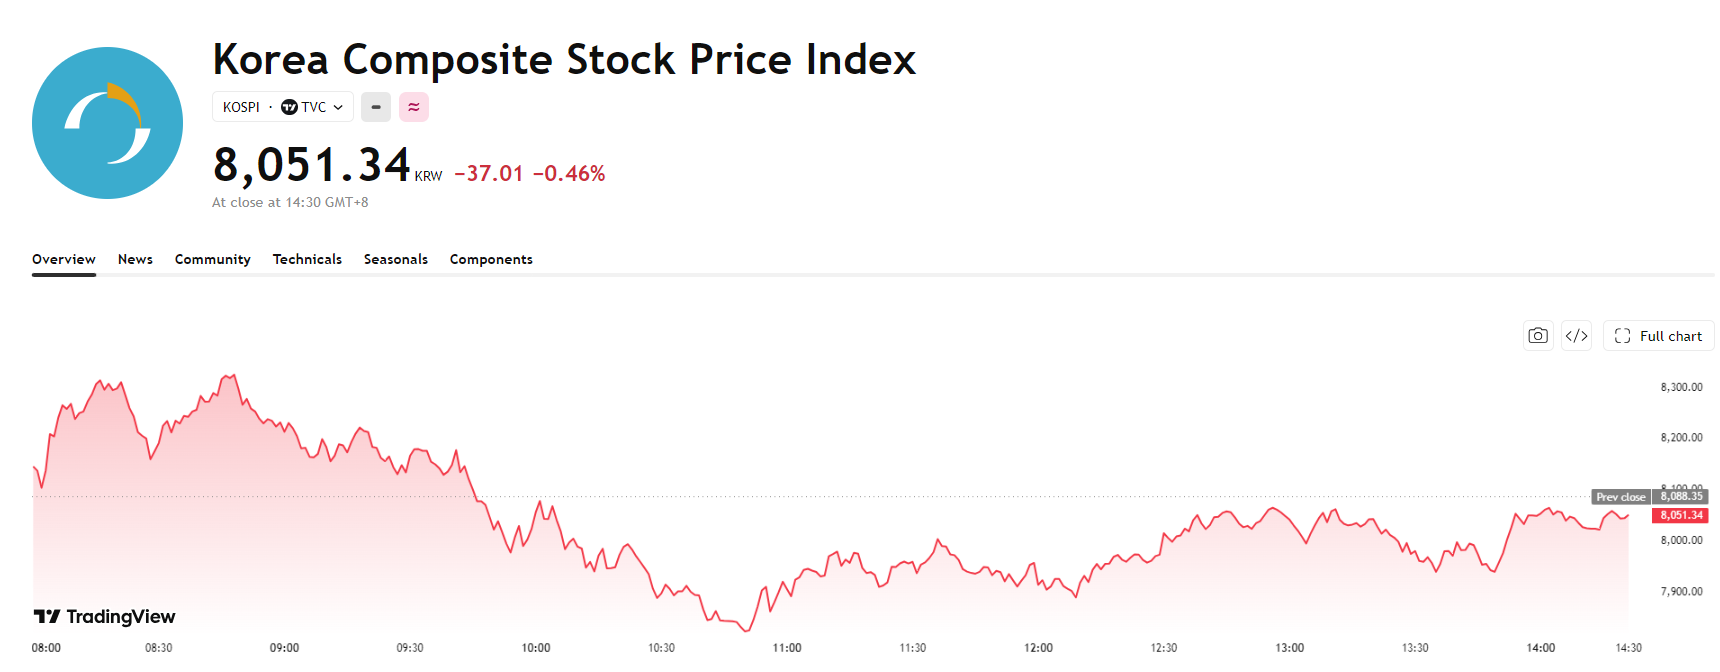
kospi-61533a76d85648bda1364032da6aa3c2KOSPI Index Chart, Source: TradingView

In terms of individual stocks, except for Samsung Electronics which rose, other heavyweights generally fell. Among them, Samsung Electronics surged over 4% in the morning, with the final gain narrowing to 2.75% to close at 318,000 KRW; SK Hynix turned from gains to losses, falling 3.38% to close at 2,343,000 KRW; Kioxia fell 2.05% to close at 81,590 JPY; SoftBank fell 3.08%, losing the 6,000 JPY threshold to close at 5,979 JPY.
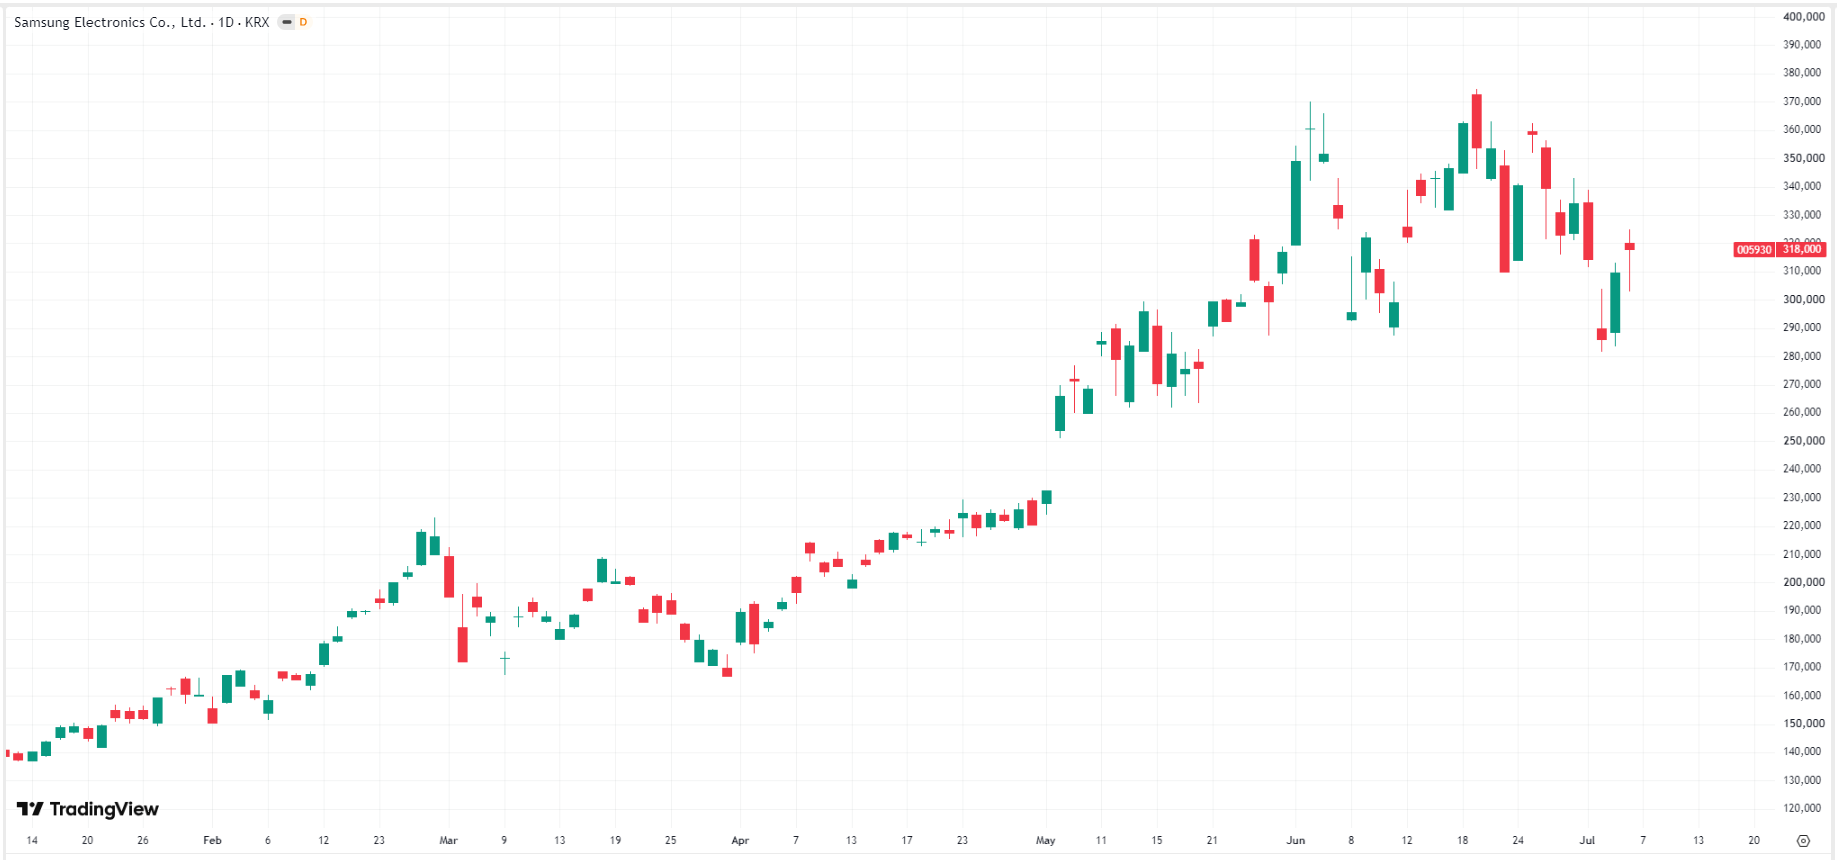
samsung-price-0fb102c1de9846829fa85d18402b184dSamsung Electronics Stock Price Chart, Source: TradingView

The Japanese and Korean stock markets showed a significant "inverted V" pattern today, quickly retreating after surging intraday. This was mainly driven by the combined effects of profit-taking selling pressure and the backlash of leveraged capital. Notably, a South Korean lawmaker warned that the KOSPI index "has degenerated into a casino" and called for the delisting of leveraged ETFs, throwing cold water on bullish market sentiment.

In addition, the market is currently in a highly sensitive state, choosing to wait for the upcoming release of Samsung Electronics' second-quarter earnings report, the results of which will serve as a key touchstone for the market to judge whether AI memory demand is truly stabilizing.

Disclaimer: For information purposes only. Past performance is not indicative of future results.
placeholder
Gold Price Analysis (XAU/USD): Gold Falls to 6-Month Low as Inflation Fuels Rate Hike Bets, A Buying Opportunity or a Falling Knife? Gold hit a 6-month low on Fed rate hike bets. However, strong central bank buying and technical indicators suggest potential tactical bounces and long-term accumulation windows.
Author  Mitrade Team
6 Month 12 Day Fri
Gold hit a 6-month low on Fed rate hike bets. However, strong central bank buying and technical indicators suggest potential tactical bounces and long-term accumulation windows.
placeholder
XRP Price Prediction for July 2026: Can Buyers Finally Break the Downtrend?XRP (XRP) price trades near $1.05, caught between a year-long downtrend and a sudden burst of buying.July has historically rewarded XRP holders. This year the month arrives with on-chain accumulation
Author  Beincrypto
6 Month 30 Day Tue
XRP (XRP) price trades near $1.05, caught between a year-long downtrend and a sudden burst of buying.July has historically rewarded XRP holders. This year the month arrives with on-chain accumulation
placeholder
Smart Money is Leaving Nvidia for This AI Chip StockNvidia stock price keeps sliding, yet the usual dip buyers are missing. Institutional money flow on the stock is the most negative of any major chip name, which means big investors are stepping back i
Author  Beincrypto
6 Month 30 Day Tue
Nvidia stock price keeps sliding, yet the usual dip buyers are missing. Institutional money flow on the stock is the most negative of any major chip name, which means big investors are stepping back i
placeholder
What to Expect From Ethereum (ETH) in July 2026Ethereum (ETH) enters July 2026 trading near $1,570, close to multi-month lows, after recording its first run of three consecutive red quarterly candles in its history.On-chain data and price charts n
Author  Beincrypto
7 Month 01 Day Wed
Ethereum (ETH) enters July 2026 trading near $1,570, close to multi-month lows, after recording its first run of three consecutive red quarterly candles in its history.On-chain data and price charts n
placeholder
NVIDIA Price Forecast: Michael Burry Shorts NVDA, but Analysts See $299On July 1, NVIDIA (NASDAQ: NVDA) sits at $198.34, failing to break above the former support level that is now serving as resistance between $198 and $205 on the 2H chart's downward blue c
Author  TradingKey
7 Month 02 Day Thu
On July 1, NVIDIA (NASDAQ: NVDA) sits at $198.34, failing to break above the former support level that is now serving as resistance between $198 and $205 on the 2H chart's downward blue c
goTop
quote