Dogecoin and Shiba Inu Price Analysis: Bearish sentiment rises as corrections deepen

แหล่งที่มา Fxstreet
  • Dogecoin price faces rejection from the $0.21 daily resistance, signaling a potential correction ahead.
  • Shiba Inu extends its decline, trading below $0.0000119, hinting at a downturn on the horizon.
  • Derivatives data show rising short bets on both DOGE and SHIB, indicating growing bearish sentiment among traders.

Dogecoin (DOGE) and Shiba Inu (SHIB) prices are extending their correction after failing to close above their key resistance zones. The bearish thesis for both dog-based memecoin is further supported by the rising short bets among traders, suggesting further correction ahead. 

Dog-based memecoins' short bets are rising among traders 

CoinGlass long-to-short ratio for DOGE and SHIB reads 0.86 and 0.82, respectively, on Wednesday, the lowest level over a month. The ratio below one suggests bearish sentiment in the market, and traders are betting that the asset price will fall.

DOGE long-to-short ratio chart. Source: CoinGlass

DOGE long-to-short ratio chart. Source: CoinGlass

SHIB long-to-short ratio chart. Source: CoinGlass

SHIB long-to-short ratio chart. Source: CoinGlass

Another derivatives metric that adds more credence to the bearish thesis is the falling funding rate. The funding rate data for both dog-based memecoin is falling, currently reading 0.0005% for DOGE and 0.0001% for SHIB on Wednesday, and is about to slip into negative territory. If the funding rate flips negative, it suggests shorts are paying longs and indicates a bearish outlook, leading to a sharp fall in the memecoins' price. 

DOGE funding rate chart. Source: CoinGlass

DOGE funding rate chart. Source: CoinGlass

SHIB funding rate chart. Source: CoinGlass

SHIB funding rate chart. Source: CoinGlass

Dogecoin Price Forecast: DOGE faces rejection from its previously broken trendline

Dogecoin price broke below the ascending trendline (drawn by connecting multiple lows since June 22) on Friday, closing below its 50-day Exponential Moving Average at $0.20. However, DOGE recovered slightly from Sunday to Monday but failed to close above the previously broken trendline and continued its correction on Tuesday. At the time of writing on Wednesday, it extends its decline trading below $0.19.

If DOGE continues its correction, it could extend the decline towards its weekly support at $0.18. A successful close below this level could extend the decline to retest its July 1 low of $0.15.

The Relative Strength Index (RSI) on the daily chart reads 42 below its neutral level of 50 and points downward, indicating strong bearish momentum. The Moving Average Convergence Divergence (MACD) continues to hold its bearish crossover and suggests the continuation of the downward trend.
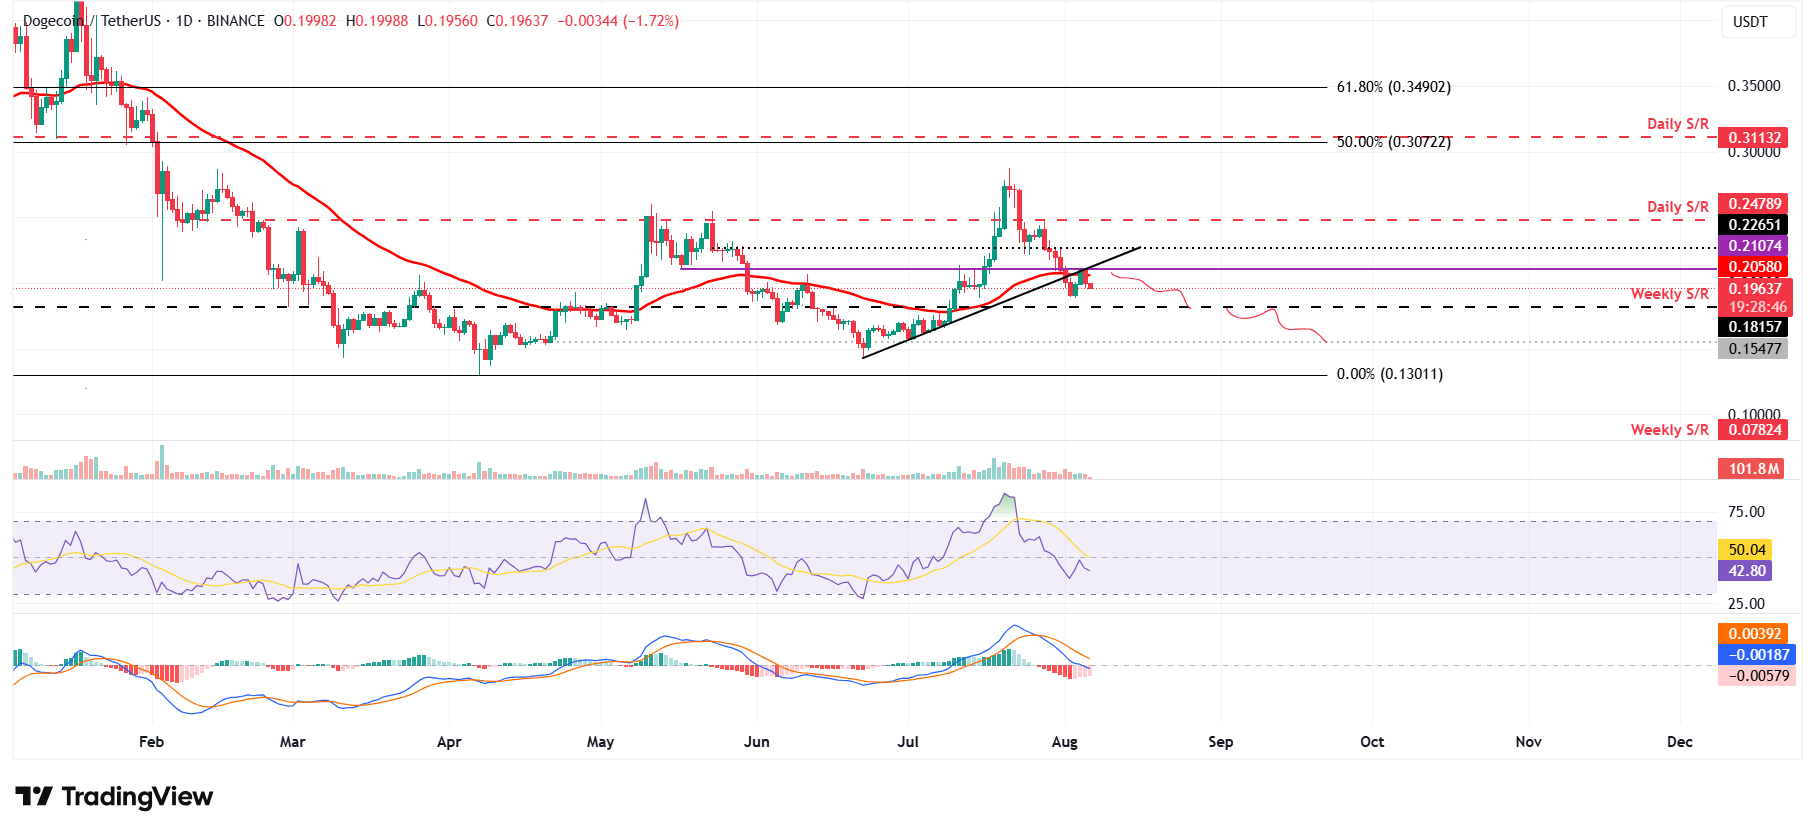
DOGE/USDT daily chart

DOGE/USDT daily chart

However, if DOGE recovers, it could extend the recovery toward its next daily resistance at $0.24.

Shiba Inu Price Forecast: SHIB bears are in control of bearish momentum 

Shiba Inu price closed below its 50-day EMA on July 29 and declined 10% in the next four days. However, SHIB recovered slightly from Sunday to Monday but failed to maintain its recovery and continued its decline on Tuesday. At the time of writing on Wednesday, it continues its correction, trading around $0.0000119.

If SHIB continues its downward trend, it could extend the decline toward its next daily support at $0.0000111. A successful close below this support could extend an additional decline toward its June 22 low of $0.0000100.

Like Dogecoin, SHIB’s RSI and MACD support the bearish thesis and downward trend. 
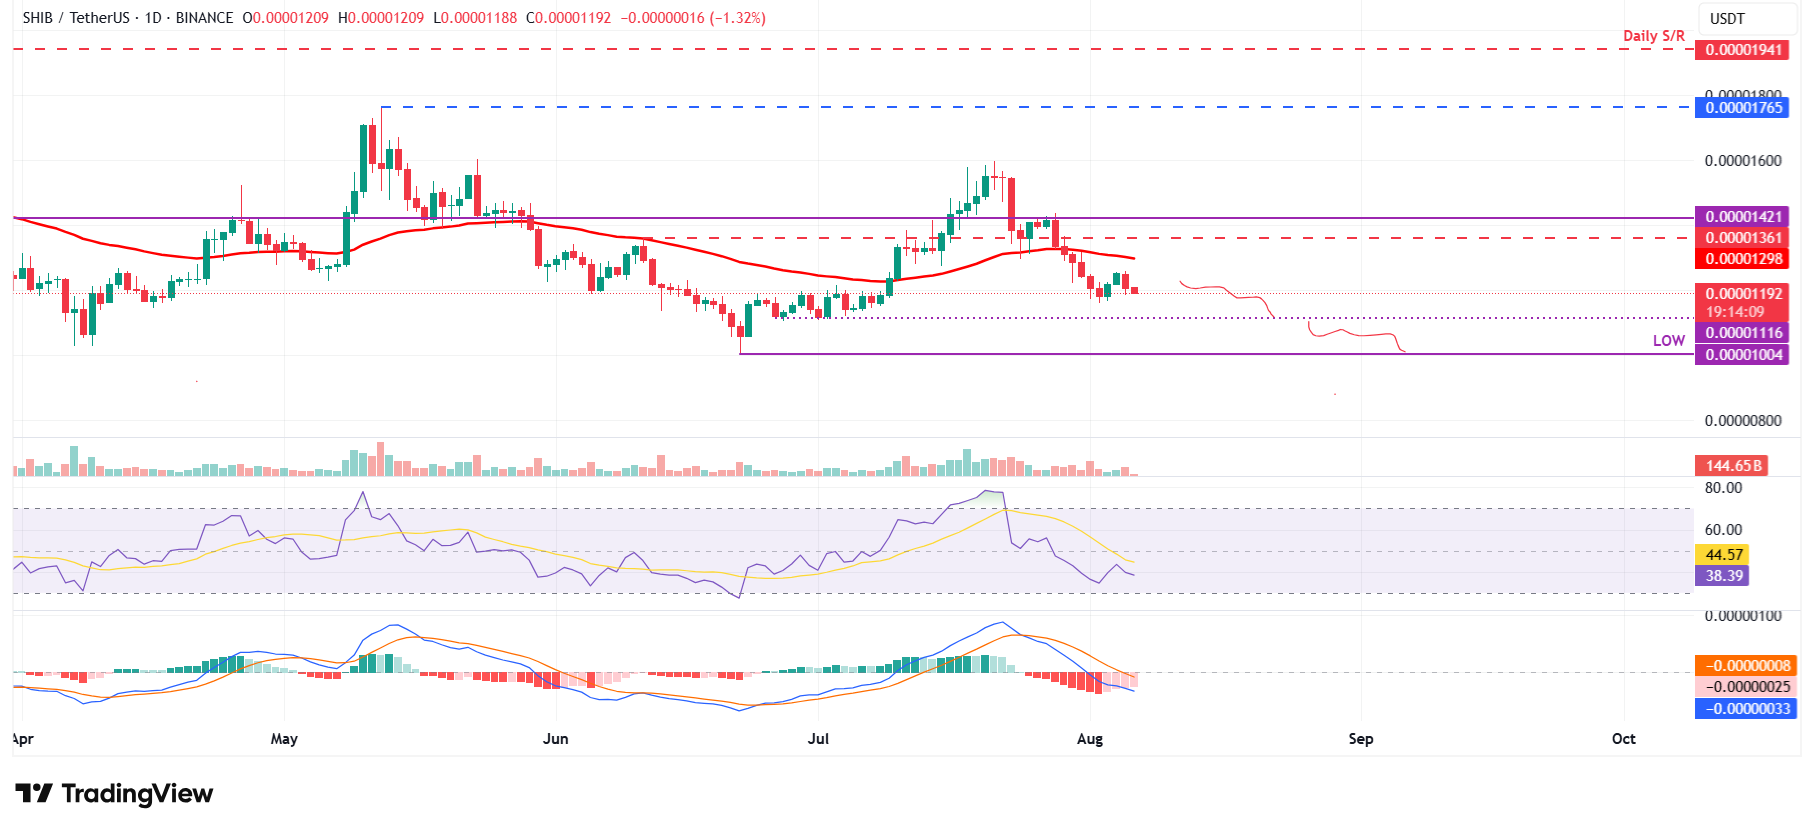
SHIB/USDT daily chart 

SHIB/USDT daily chart 

On the other hand, if SHIB recovers and closes above the 50-day EMA on a daily basis, it could extend the recovery toward its next daily resistance at $0.0000136.

ข้อจำกัดความรับผิดชอบ: เพื่อการอ้างอิงเท่านั้น ผลการดำเนินงานในอดีตไม่ได้บ่งบอกถึงผลลัพธ์ในอนาคต
placeholder
EUR/USD ยังคงซบเซาใกล้ระดับ 1.1650 หลังจากข้อมูลยอดค้าปลีกของเยอรมนี รอข้อมูล CPIEUR/USD หยุดการปรับตัวขึ้นสามวันติดต่อกัน ราคาเคลื่อนไหวอยู่ที่ประมาณ 1.1660 ในช่วงเวลายุโรปวันศุกร์ คู่สกุลเงินเคลื่อนไหวเล็กน้อยหลังจากการเปิดเผยข้อมูลยอดค้าปลีกของเยอรมนีที่น่าผิดหวัง ข้อมูลดัชนีราคาผู้บริโภค (CPI) เบื้องต้นของเยอรมนีจะถูกจับตามองในภายหลังของวันนั้น
ผู้เขียน  FXStreet
8 เดือน 29 วัน ศุกร์
EUR/USD หยุดการปรับตัวขึ้นสามวันติดต่อกัน ราคาเคลื่อนไหวอยู่ที่ประมาณ 1.1660 ในช่วงเวลายุโรปวันศุกร์ คู่สกุลเงินเคลื่อนไหวเล็กน้อยหลังจากการเปิดเผยข้อมูลยอดค้าปลีกของเยอรมนีที่น่าผิดหวัง ข้อมูลดัชนีราคาผู้บริโภค (CPI) เบื้องต้นของเยอรมนีจะถูกจับตามองในภายหลังของวันนั้น
placeholder
WTI ลดลงต่ำกว่า $64.00 ขณะที่สหรัฐฯ มุ่งเป้าไปที่อินเดียน้ำมันดิบเวสต์เทกซัสอินเตอร์มีเดียต (WTI) ซึ่งเป็นเกณฑ์มาตรฐานน้ำมันดิบของสหรัฐฯ ซื้อขายอยู่ที่ประมาณ 63.85 ดอลลาร์ในช่วงเช้าของตลาดลงทุนเอเชียวันศุกร์ ราคาน้ำมัน WTI ปรับตัวลดลงเล็กน้อยท่ามกลางความกังวลเกี่ยวกับอุปทานที่มากเกินไปและแรงกดดันจากสหรัฐฯ ต่ออินเดียให้หยุดการนำเข้าน้ำมันจากรัสเซีย
ผู้เขียน  FXStreet
8 เดือน 29 วัน ศุกร์
น้ำมันดิบเวสต์เทกซัสอินเตอร์มีเดียต (WTI) ซึ่งเป็นเกณฑ์มาตรฐานน้ำมันดิบของสหรัฐฯ ซื้อขายอยู่ที่ประมาณ 63.85 ดอลลาร์ในช่วงเช้าของตลาดลงทุนเอเชียวันศุกร์ ราคาน้ำมัน WTI ปรับตัวลดลงเล็กน้อยท่ามกลางความกังวลเกี่ยวกับอุปทานที่มากเกินไปและแรงกดดันจากสหรัฐฯ ต่ออินเดียให้หยุดการนำเข้าน้ำมันจากรัสเซีย
placeholder
คาดการณ์ราคาเงิน: XAGUSD พุ่งขึ้นสู่ระดับ $39.00 ขณะที่การเก็งการลดดอกเบี้ยของเฟดเพิ่มขึ้นราคาโลหะเงิน (XAG/USD) ปรับตัวเพิ่มขึ้นมากกว่า 0.5% โดยซื้อขายอยู่ที่ประมาณ $38.80 ต่อออนซ์ในช่วงเช้าของตลาดลงทุนยุโรปวันพฤหัสบดี ราคาโลหะเงินที่ไม่ให้ผลตอบแทนปรับตัวขึ้นท่ามกลางความน่าจะเป็นที่เพิ่มขึ้นของการปรับลดอัตราดอกเบี้ยของธนาคารกลางสหรัฐฯ (เฟด)
ผู้เขียน  FXStreet
8 เดือน 28 วัน พฤหัส
ราคาโลหะเงิน (XAG/USD) ปรับตัวเพิ่มขึ้นมากกว่า 0.5% โดยซื้อขายอยู่ที่ประมาณ $38.80 ต่อออนซ์ในช่วงเช้าของตลาดลงทุนยุโรปวันพฤหัสบดี ราคาโลหะเงินที่ไม่ให้ผลตอบแทนปรับตัวขึ้นท่ามกลางความน่าจะเป็นที่เพิ่มขึ้นของการปรับลดอัตราดอกเบี้ยของธนาคารกลางสหรัฐฯ (เฟด)
placeholder
ทองคำดึงดูดผู้ขายบางส่วนท่ามกลางการทำกำไร ข้อมูล GDP สหรัฐฯ เป็นจุดสนใจราคาทองคํา (XAU/USD) เคลื่อนไหวในแดนลบในช่วงเวลาการซื้อขายของเอเชียในวันพฤหัสบดี โลหะมีค่าถอยตัวลงจากจุดสูงสุดในรอบ 3 สัปดาห์ใกล้ระดับ $3,400 ท่ามกลางการกลับมาของดอลลาร์สหรัฐ (USD) และการปิดออเดอร์เพื่อทำกำไร
ผู้เขียน  FXStreet
8 เดือน 28 วัน พฤหัส
ราคาทองคํา (XAU/USD) เคลื่อนไหวในแดนลบในช่วงเวลาการซื้อขายของเอเชียในวันพฤหัสบดี โลหะมีค่าถอยตัวลงจากจุดสูงสุดในรอบ 3 สัปดาห์ใกล้ระดับ $3,400 ท่ามกลางการกลับมาของดอลลาร์สหรัฐ (USD) และการปิดออเดอร์เพื่อทำกำไร
placeholder
AUD/USD ขยายตัวขึ้นเหนือ 0.6500 ขณะที่ความหวังในการลดอัตราดอกเบี้ยของ RBA ลดน้อยลงคู่ AUD/USD ขยายการปรับตัวขาขึ้นเข้าใกล้ระดับ 0.6505 ในช่วงเช้าของตลาดลงทุนเอเชียวันพฤหัสบดี ดอลลาร์ออสเตรเลีย (AUD) ปรับตัวสูงขึ้นเมื่อเทียบกับดอลลาร์สหรัฐ (USD) เนื่องจากข้อมูลเงินเฟ้อของออสเตรเลียที่ร้อนแรงเกินคาดทำให้การเก็งการปรับลดอัตราดอกเบี้ยของธนาคารกลางออสเตรเลีย (RBA) ลดลง
ผู้เขียน  FXStreet
8 เดือน 28 วัน พฤหัส
คู่ AUD/USD ขยายการปรับตัวขาขึ้นเข้าใกล้ระดับ 0.6505 ในช่วงเช้าของตลาดลงทุนเอเชียวันพฤหัสบดี ดอลลาร์ออสเตรเลีย (AUD) ปรับตัวสูงขึ้นเมื่อเทียบกับดอลลาร์สหรัฐ (USD) เนื่องจากข้อมูลเงินเฟ้อของออสเตรเลียที่ร้อนแรงเกินคาดทำให้การเก็งการปรับลดอัตราดอกเบี้ยของธนาคารกลางออสเตรเลีย (RBA) ลดลง
ตราสารที่เกี่ยวข้อง
goTop
quote