
Stellar Price Forecast: XLM eyes further gains amid record-high Open Interest levels, Golden Cross
- Stellar’s XLM has recorded a surge of over 90% so far in July, aiming to surpass the $0.50 level.
- Transactions and new addresses surge on Stellar, suggesting increased network activity.
- The XLM Open Interest hit a record high of $520 million on Tuesday, signaling a massive surge in traders’ interest.
Stellar (XLM) ticks higher nearly 4% at press time on Wednesday, advancing the last week’s rally for a 95% surge so far in July, outperforming Ripple’s (XRP) 31% rise. A surge in network activity, reflected in increased transactions and new addresses, aligns with the growing optimism among traders, fueling the XLM Open Interest to surpass $500 million.
Stellar’s network activity surge outpaces XRP ledger
The Block’s data displays a significant increase in Stellar’s number of new active addresses to 12.36K (the 7-day moving average of the number of unique addresses that have been active in the network) as on Monday, outpacing XRP Ledger’s increase to 8.34K addresses. A spike in the number of new active addresses refers to network adoption among new users.
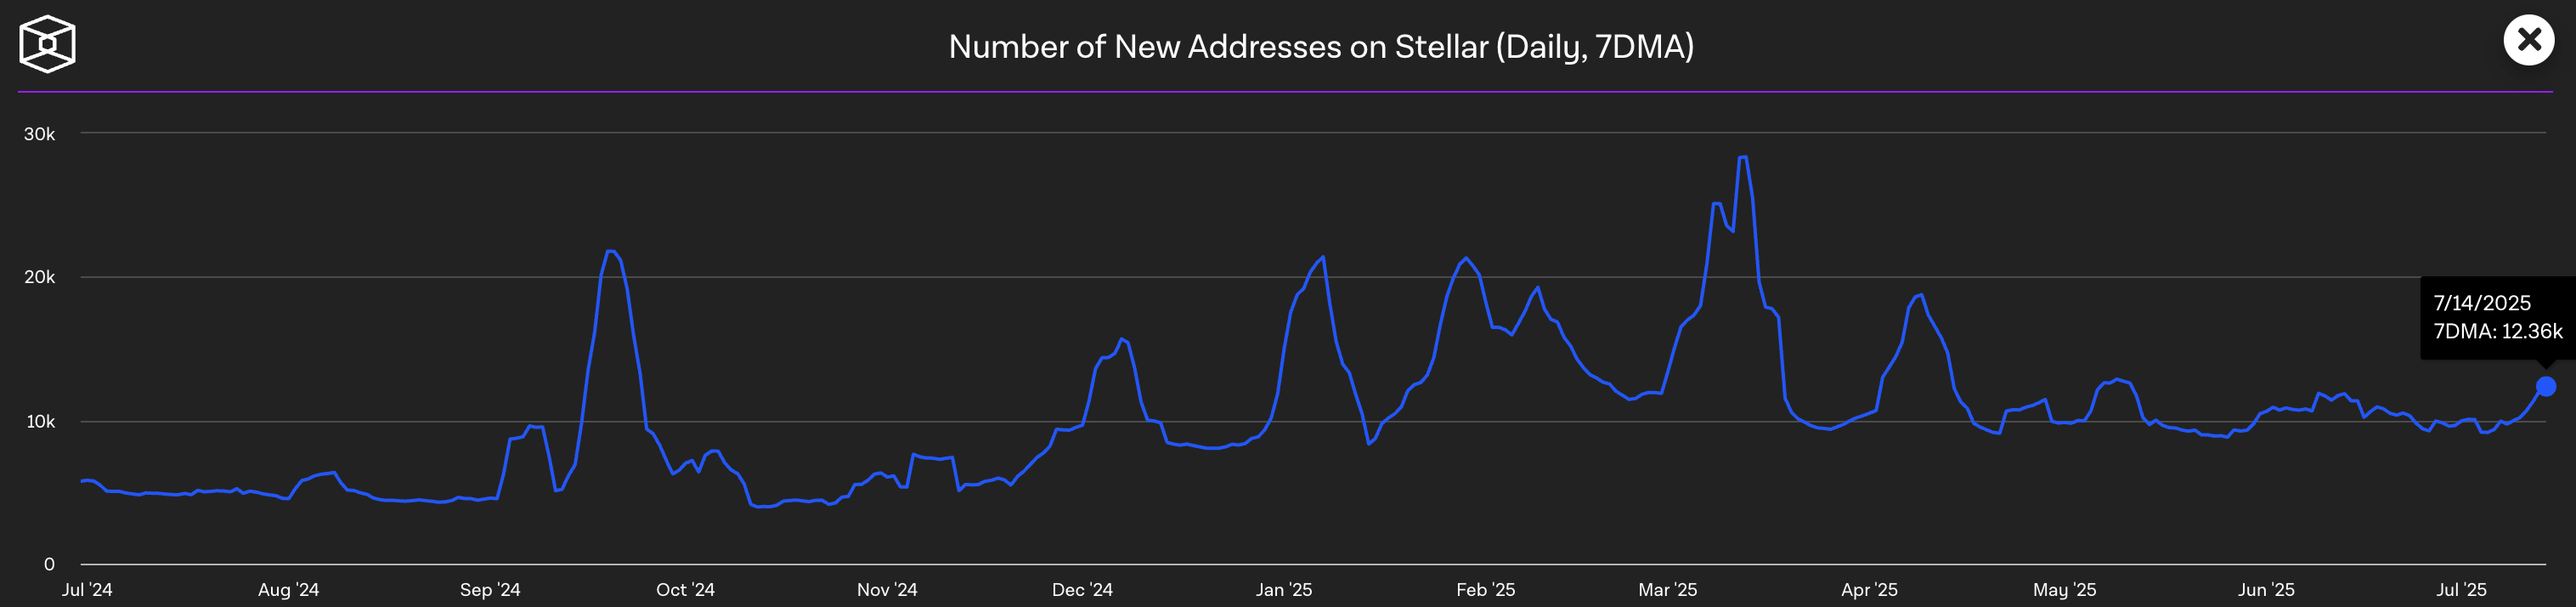
Number of new addresses on Stellar. Source: The Block
Stellar dominates the transaction count, with 5.20 million transactions (7-day moving average) as on Monday, significantly more than the 1.92 million on the XRP Ledger. An increase in transaction count is a direct result of heightened user activity.
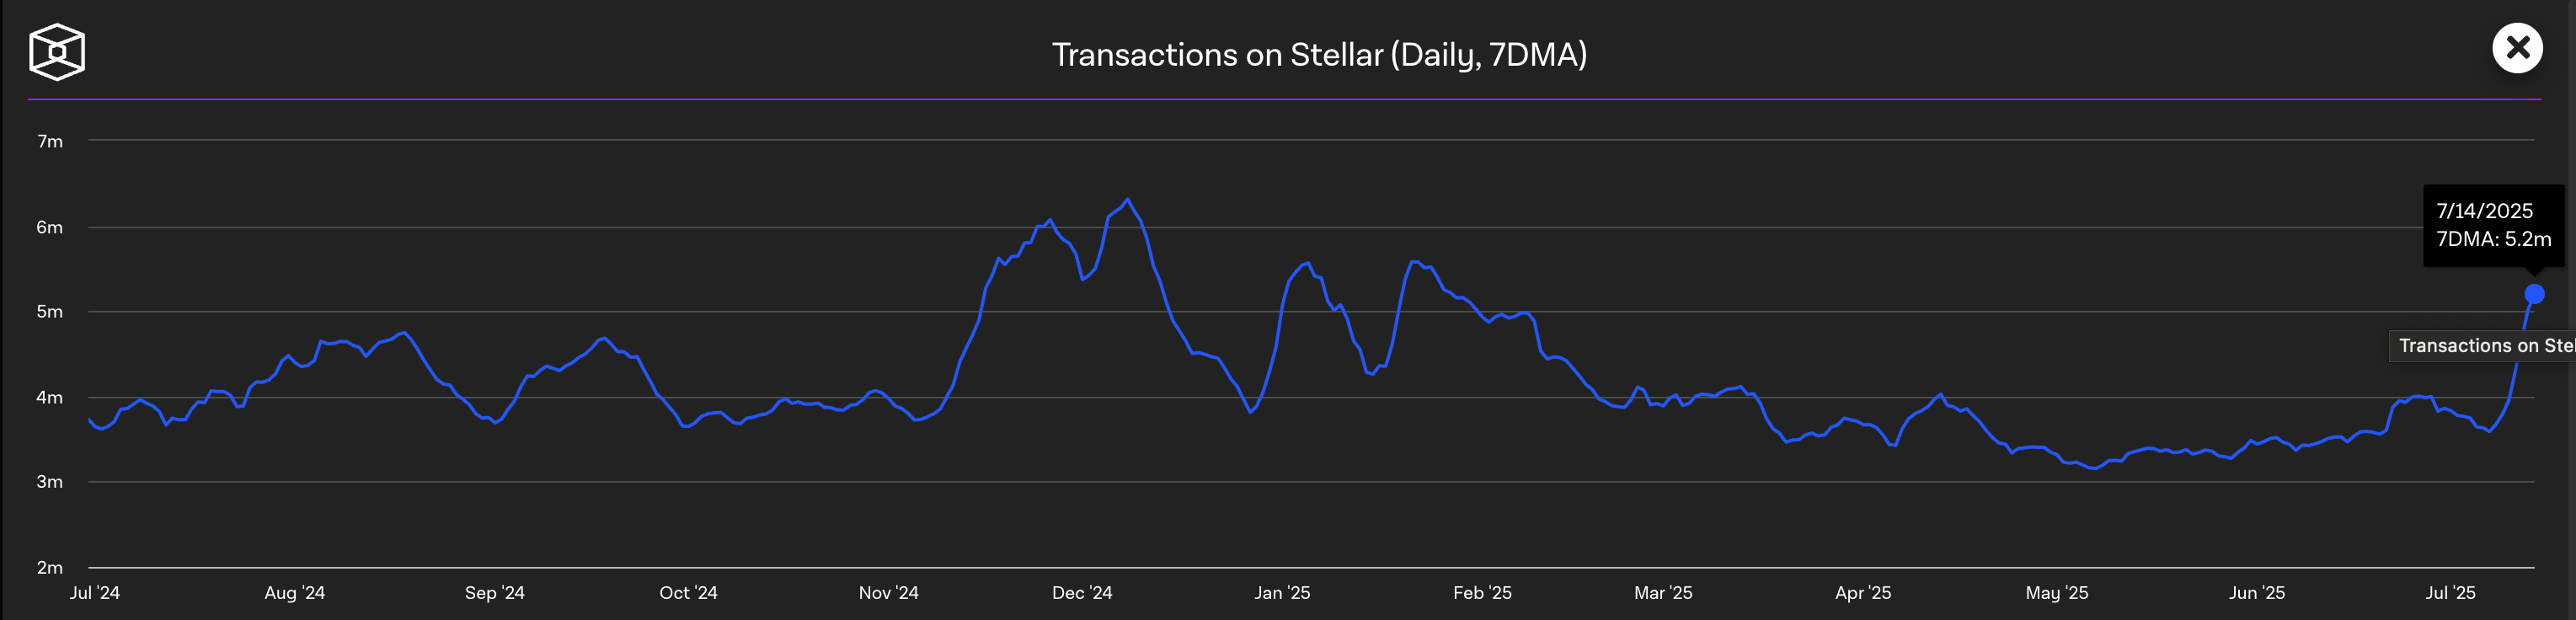
Transaction count on Stellar. Source: The Block
If Stellar sustains dominance in network growth, it could win the cross-border payment token race.
XLM eyes $0.50 breakout amid a golden cross, record high Open Interest
XLM fluctuates between the 61.8% and 78.6% Fibonacci retracement levels at $0.4310 and $0.4880, respectively, drawn from the December 1 close of $0.5607 to the April 8 close of $0.2212.
The altcoin extends the bounce back from the 61.8% Fibonacci level on Tuesday, for a near 4% appreciation on the day. If XLM bulls stretch the uptrend for a daily close above $0.4880, it could reclaim the $0.50 round figure, followed by the $0.5607 peak.
The bullish run in XLM triggered a golden cross between the 50-day and 200-day Exponential Moving Averages (EMAs) on July 13, indicating a fresh bullish trend that outpaces the longer-term trend.
The Moving Average Convergence/Divergence (MACD) indicator displays a positive trend, indicated by green histogram bars, suggesting increased bullish momentum.
Still, the Relative Strength Index (RSI) reads 83 after a minor drop in the overbought zone. Investors must remain cautious, as overbought conditions could result in sharp pullbacks.
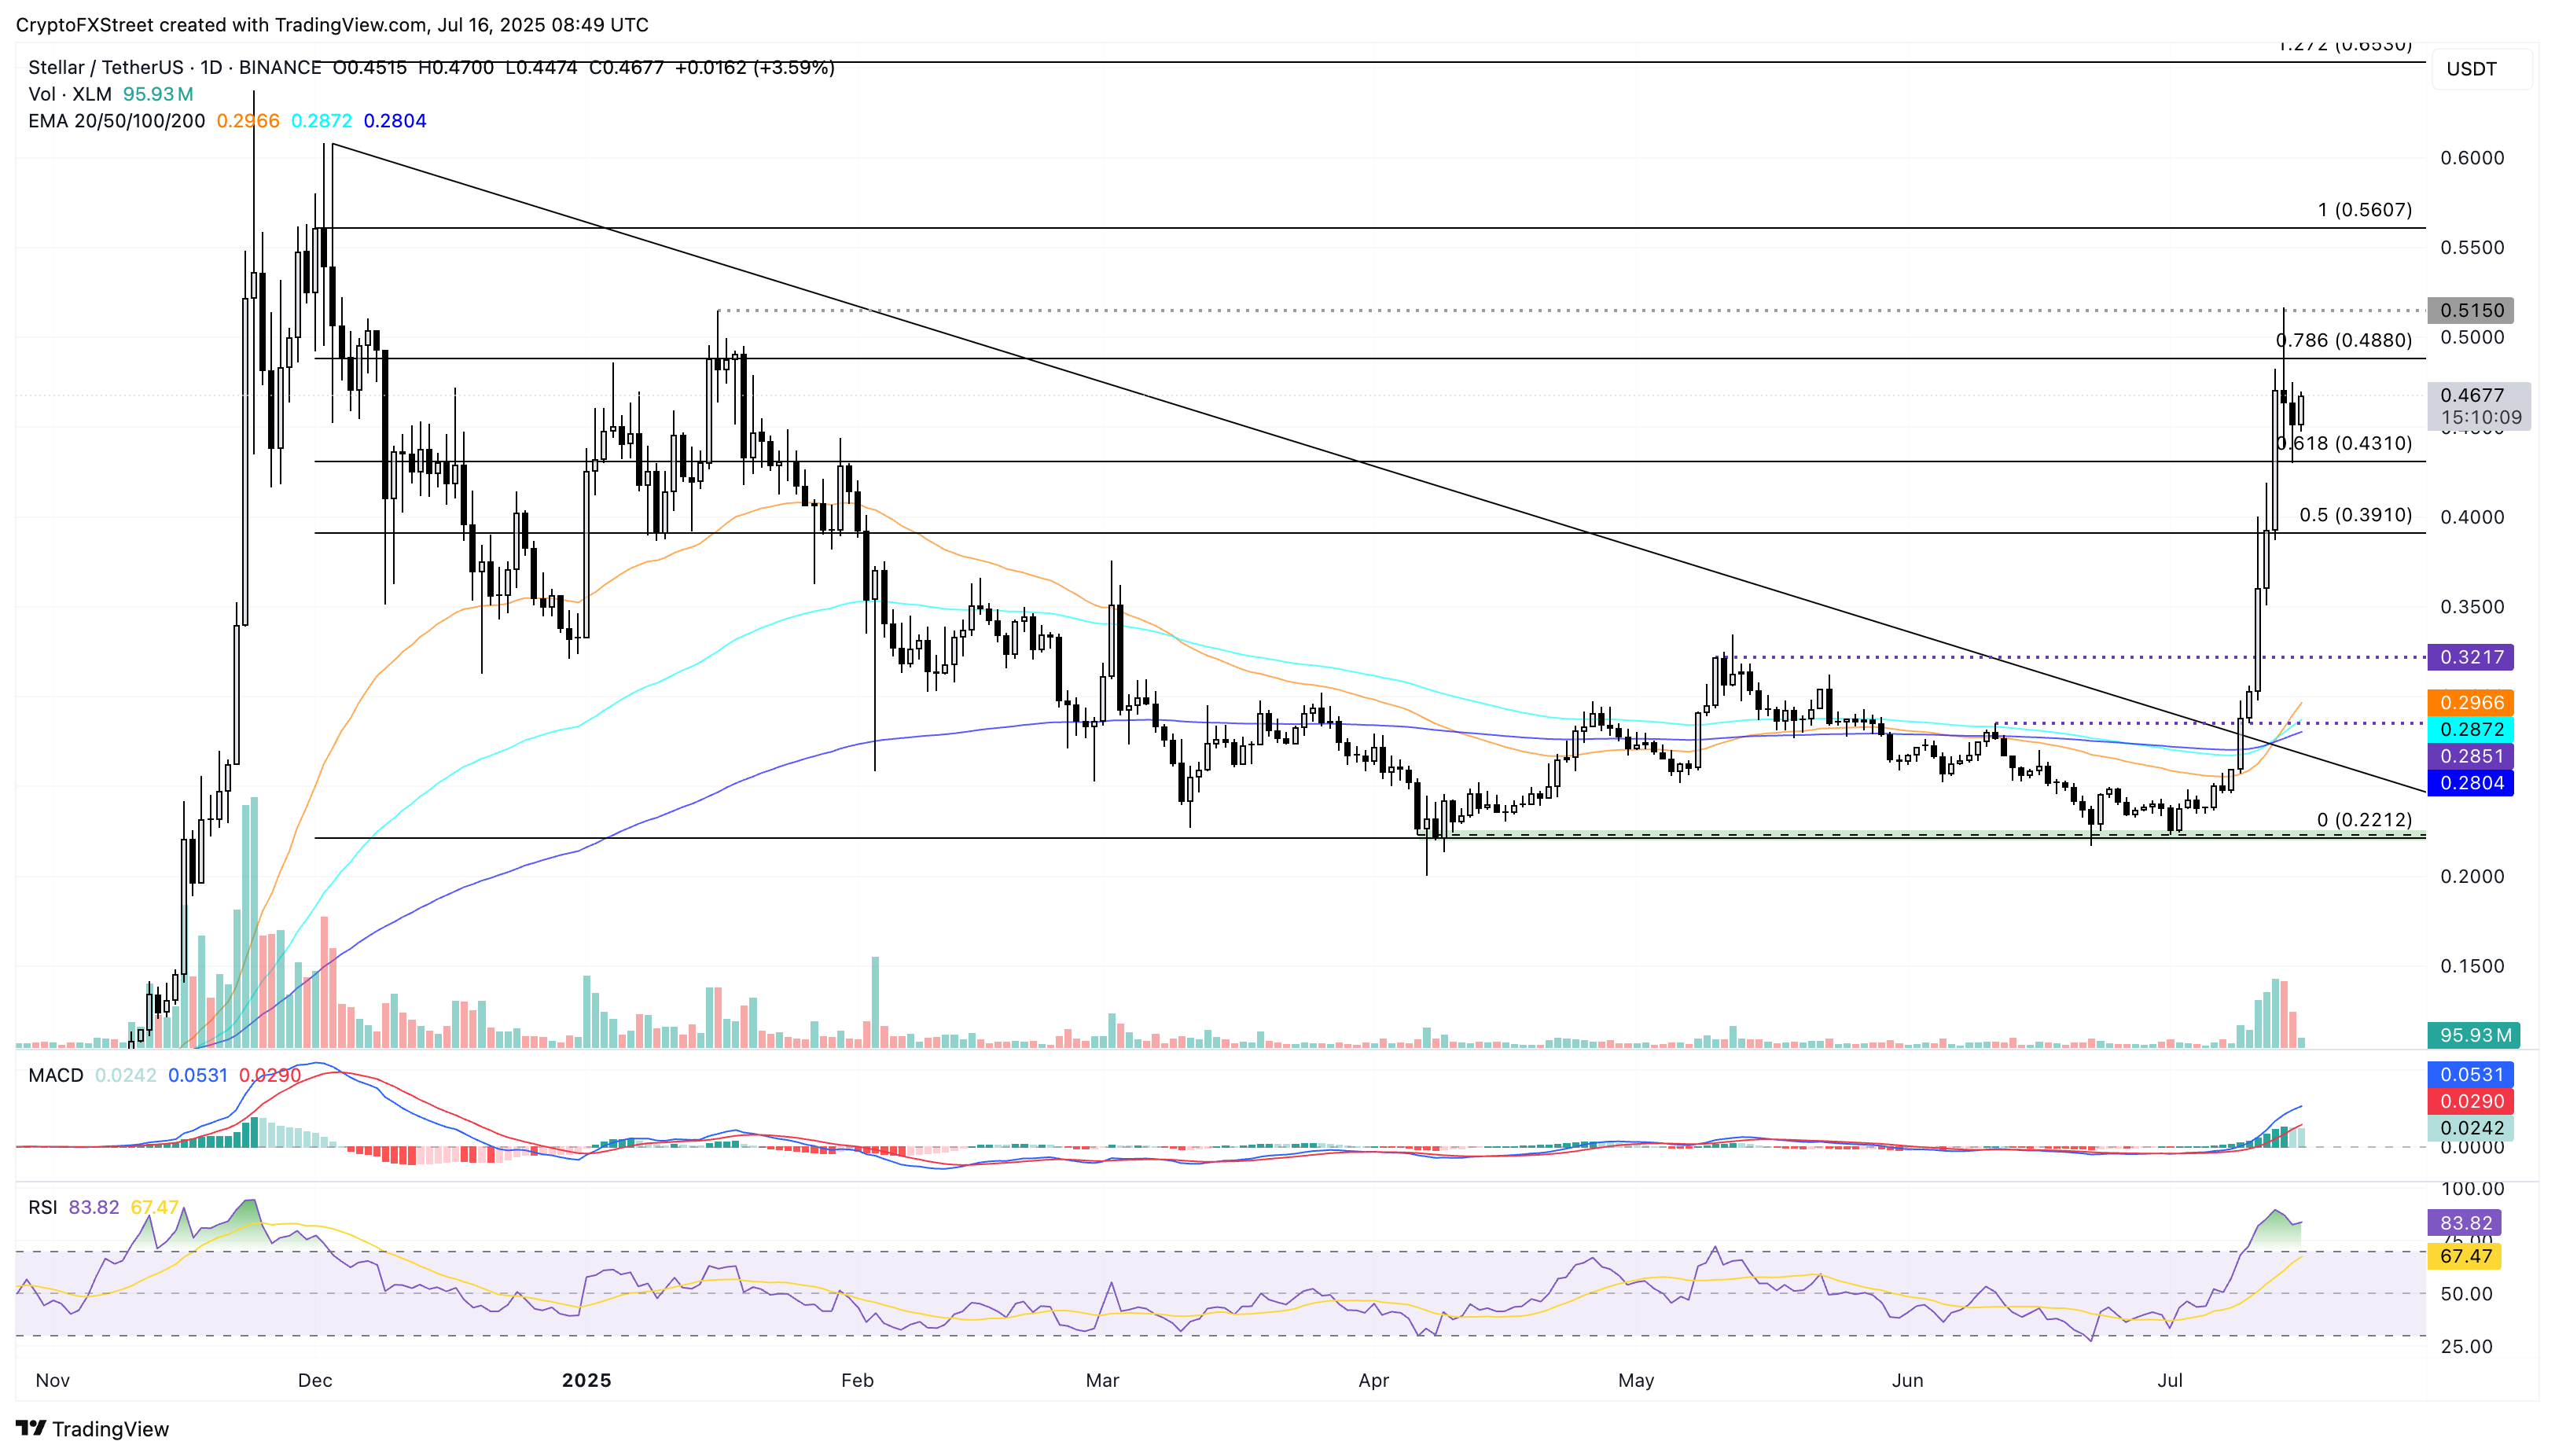
XLM/USDT daily price chart.
CoinGlass data shows that XLM Open Interest (OI) has dropped to $479.02 million, after reaching a record high of $520.03 million on Tuesday. The OI holds at record levels, suggesting increased capital inflows in XLM derivatives, a sign of heightened optimism.
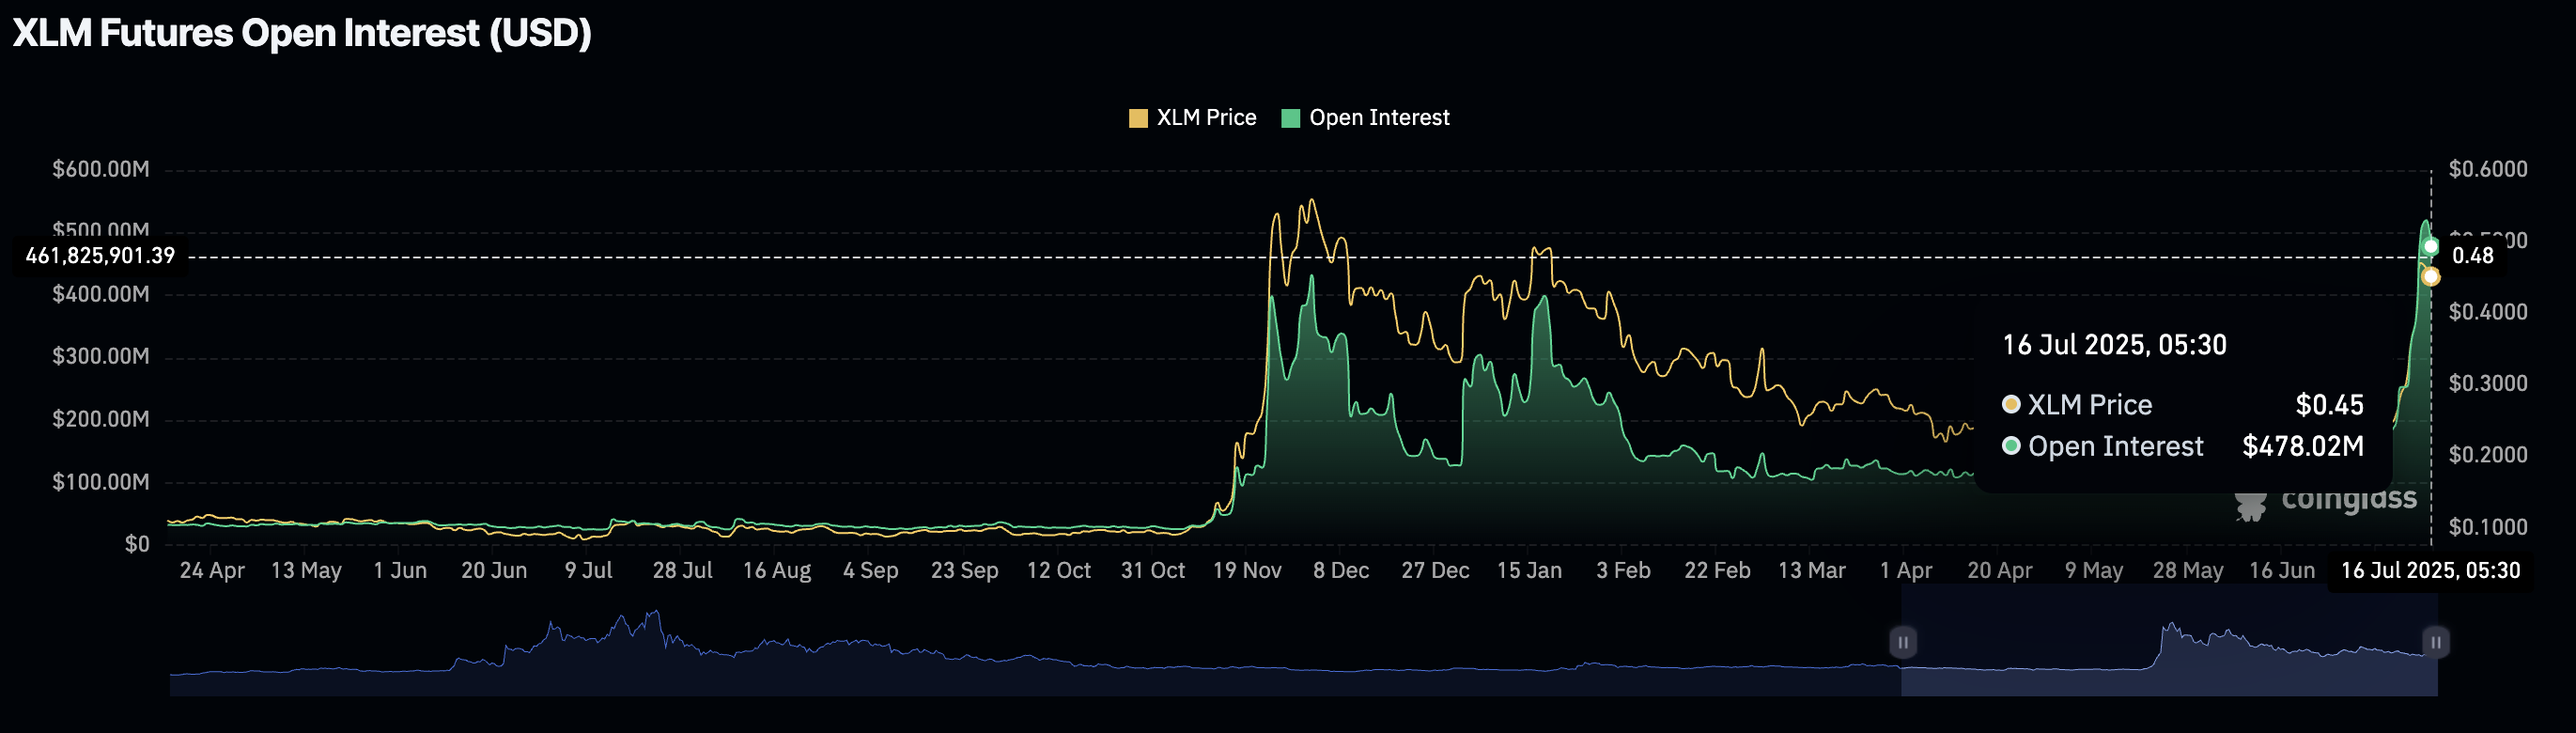
XLM Open Interest. Source: Coinglass
On the contrary, a daily close below the 61.8% Fibonacci retracement level at $0.4310 could extend the XLM declining trend to $0.3910, aligning with the 50% Fibonacci level.
บทความแนะนำ


