
Polygon Price Forecast: POL rallies as bulls position ahead of Heimdall v2 upgrade
- Polygon price continues to trade higher on Wednesday, rallying nearly 9% so far this week.
- POL is set to implement the Heimdall v2 upgrade on Thursday, aiming to reduce finality and eliminate legacy technical debt.
- Technical indicators show a bullish momentum, suggesting the rally could continue in the near term.
Polygon (POL) continues to trade higher by nearly 4% on Wednesday, at around $0.20 at the time of writing, having rallied almost 9% so far this week. This price surge comes ahead of POL’s much-anticipated Heimdall v2 upgrade, scheduled for Thursday, which is expected to boost investor confidence and improve network performance. From the technical viewpoint, momentum indicators show a bullish outlook, suggesting the rally could continue in the near term.
Polygon’s Heimdall v2 upgrade could boost its network performance
POL is set to implement the Heimdall v2 upgrade on Thursday, aiming to reduce finality and eliminate legacy technical debt.
This upgrade is “the most technically complex hard-fork Polygon PoS has seen since its launch in 2020,” said Polygon’s CEO, Sandeep Nailwal, in his X post on Tuesday.
Sandeep continued that the update is expected to eliminate all technical debt from its previous build in the 2018 to 2019 era and shorten finality to approximately five seconds.

The Heimdall upgrade could enable faster checkpoints, a smoother user experience, safer bridging, and provide headroom for the next wave of upgrades, which in turn could boost investor confidence and drive a price rise in its native token, POL.
Polygon Price Forecast: POL breaking above key resistance zone
Polygon price is pushing to break above a descending trendline, drawn by connecting multiple highs since mid-May, on Wednesday. This level roughly coincides with the daily resistance level at $0.197 and the 50-day Exponential Moving Average (EMA) at $0.199, making it a key area of resistance.
If POL closes above the 50-day EMA at $0.199 on a daily basis, it could extend the rally toward the 50% Fibonacci retracement, drawn from the May 11 high of $0.277 to the June 22 low of $0.164, at $0.220.
The Relative Strength Index (RSI) on the daily chart reads 56 and points upwards, indicating that bullish momentum is gaining traction. Additionally, the Moving Average Convergence Divergence (MACD) indicator showed a bullish crossover on June 29. It also shows rising green histogram bars above its neutral zero line, suggesting bullish momentum is gaining traction and continuing an upward trend.
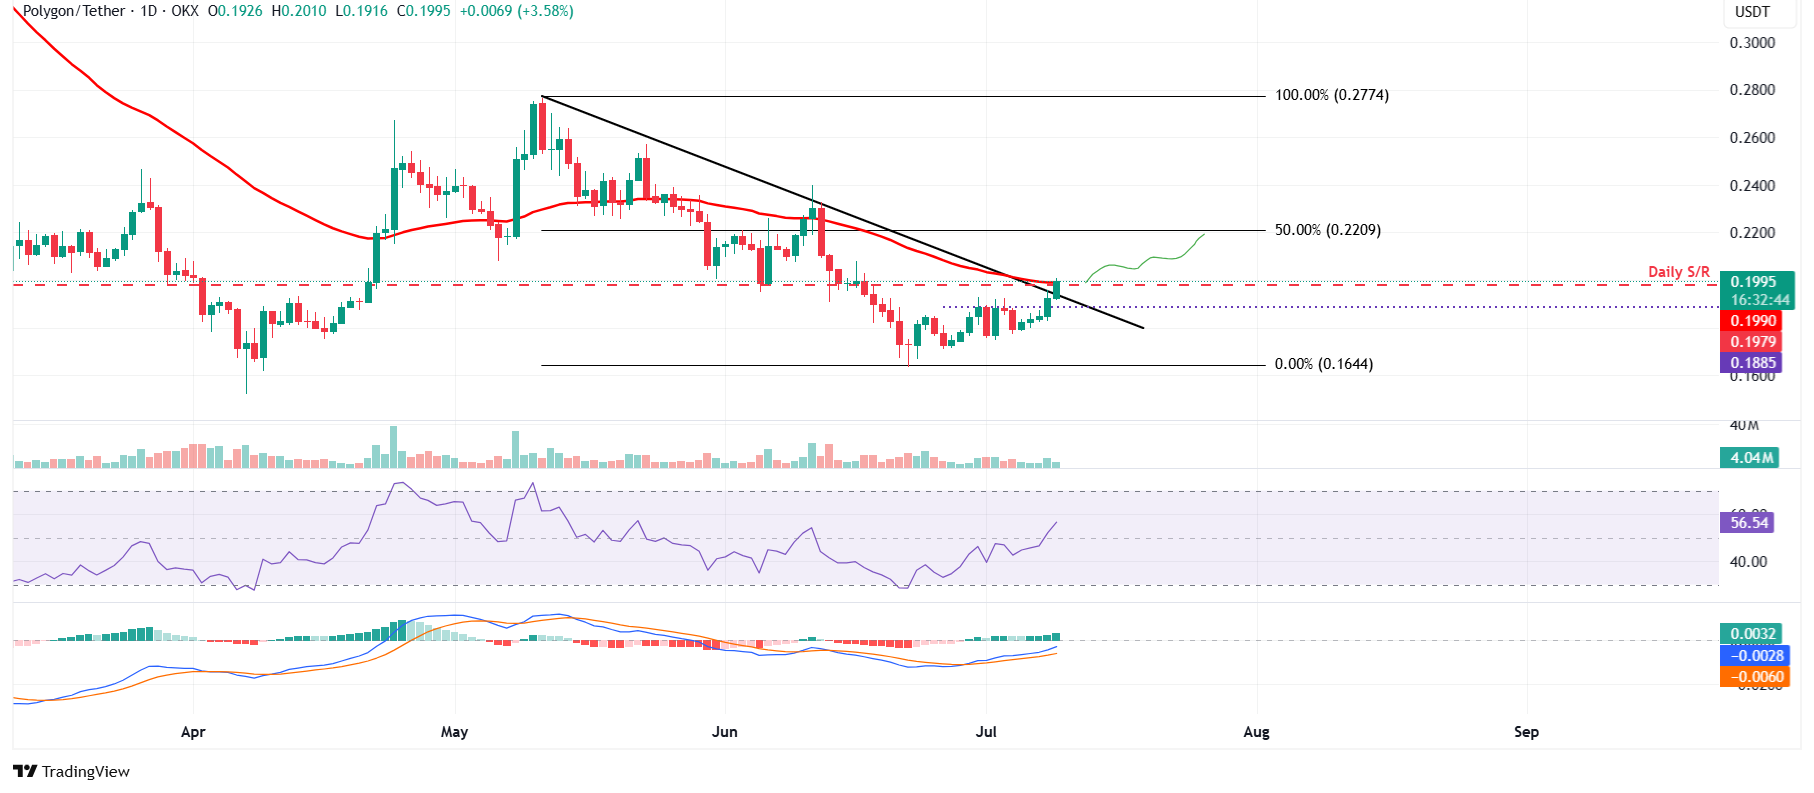
POL/USDT daily chart
However, if POL faces a correction, it could extend the decline to retest its next daily support at $0.188.
บทความแนะนำ


