BNB Price Forecast: BNB bulls aim above $700 as stablecoin and DEX activity surge

แหล่งที่มา Fxstreet
  • BNB price stabilizes around $674 on Tuesday after a three-day recovery rally.
  • On-chain data support the bullish outlook, withBNB’s DEX volume and stablecoin activity rising sharply.
  • The technical outlook shows a bullish breakout, aiming for a higher leg.

BNB (BNB) stabilizes around $674 on Tuesday after a three-day recovery rally. On-chain data and technical outlook suggest a rally ahead as BNB breaks above the symmetrical triangle pattern, with DEX (Decentralized exchange) volume and stablecoin activity surging.

BNB on-chain data show bullish bias

BNB’s stablecoin value has been actively rising and reached $24.2 billion, the highest year-to-date (YTD) level on May 21, according to Atermis terminal data. While the volume has retreated somewhat in recent days, the current level ofstablecoin activity and value increase on BNB is positive as they increase network usage and can attract more users to the ecosystem.

BNB chain stablecoin activity chart. Source: Artemis

BNB chain stablecoin activity chart. Source: Artemis

Another aspect bolstering the platform’s bullish outlook is the recent surge in traders’ interest and liquidity in the BNB chain. The chart below shows that BNB’s DEX daily trading volume soared to $11.8 billion on May 21, the highest YTD and constantly rising since mid-May. 
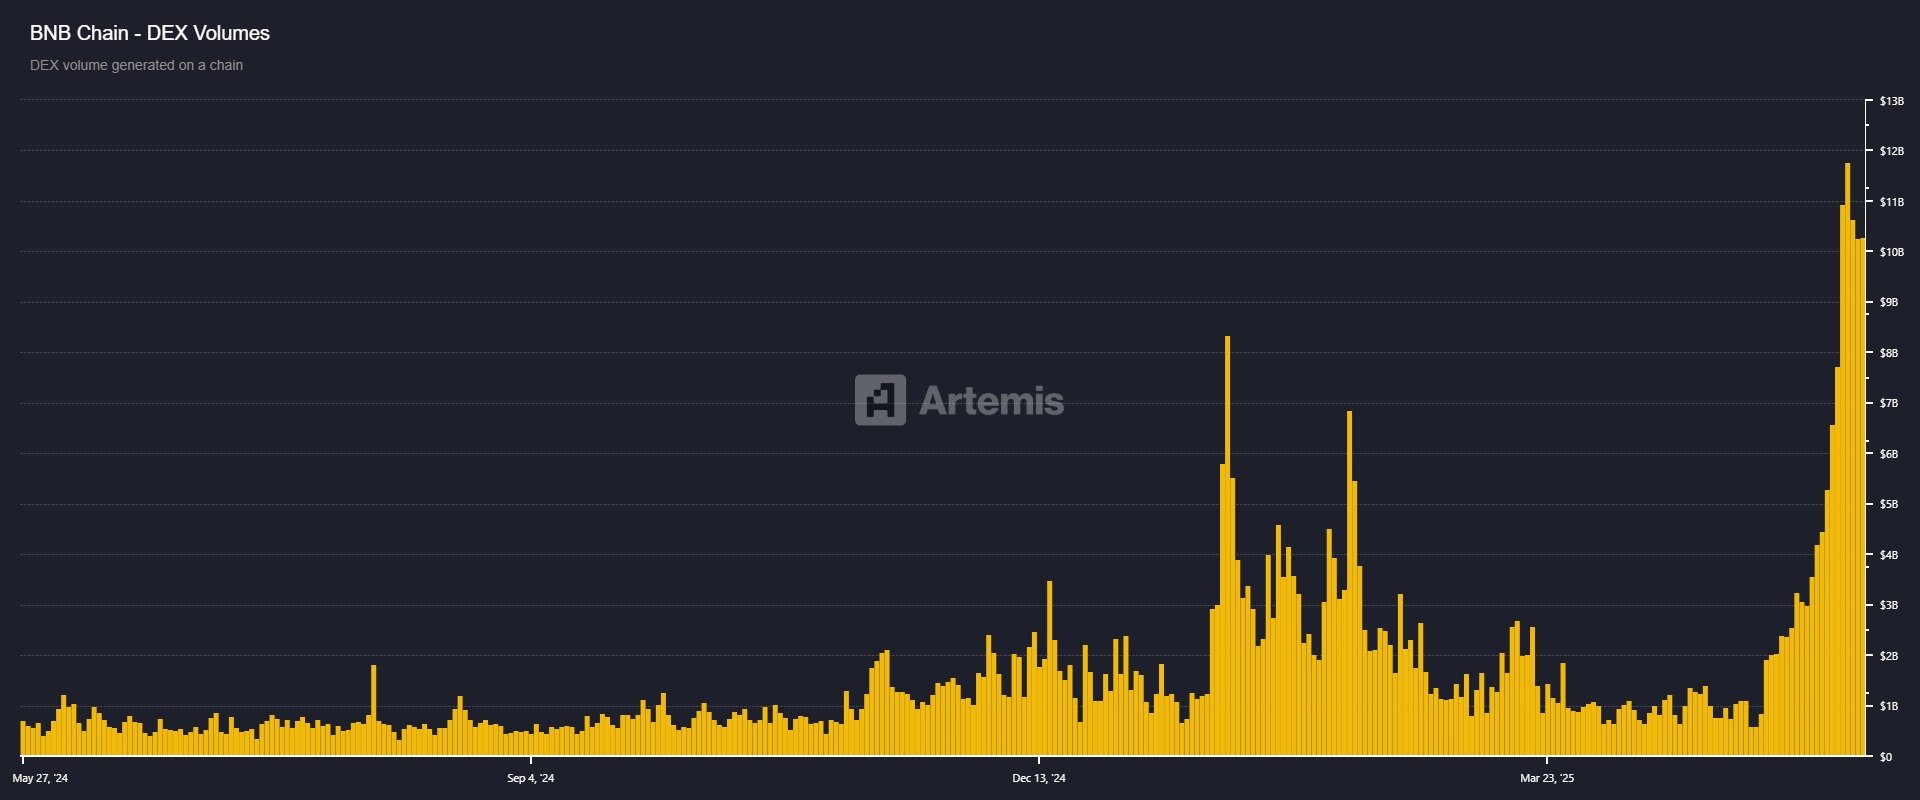
BNB chain Dex volume chart. Source: Artemis

BNB chain Dex volume chart. Source: Artemis

BNB Price Forecast: Bullish symmetrical triangle breakout emerges

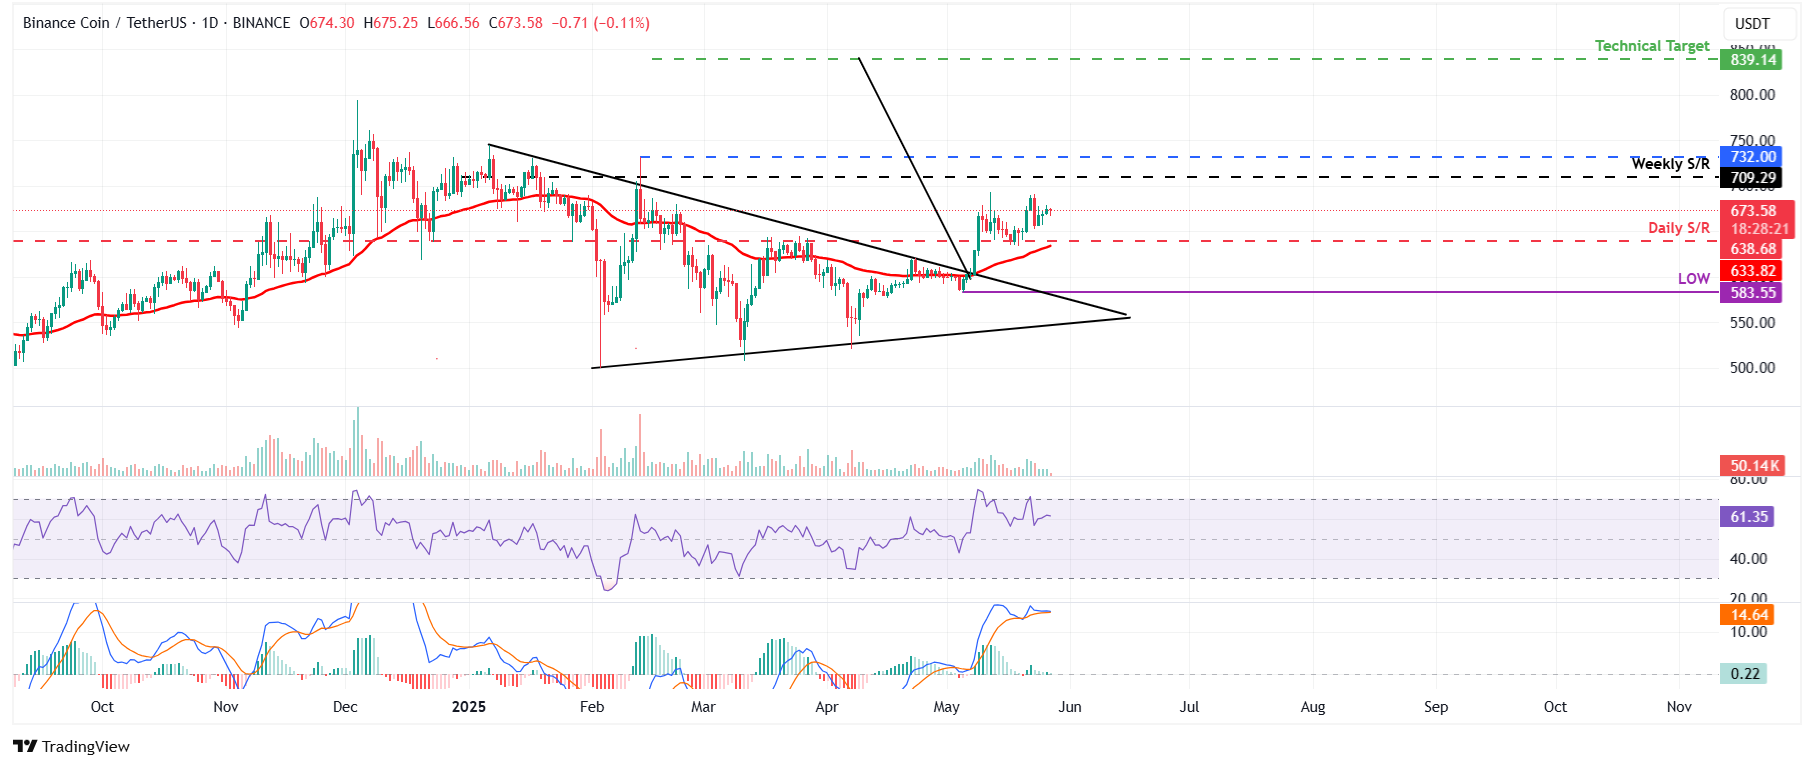
BNB’s price broke above a symmetrical triangle on May 8, a technical pattern formed by connecting multiple highs and lows with two converging trendlines (from January to early May), and rallied more than 10%. However, BNB corrected 4.31% last Friday but recovered slightly in the following three days. At the time of writing on Tuesday, it hovers around $673.50.

BNB price could extend the rally to reach the technical target of the symmetrical triangle at $839.14 (obtained by measuring the distance between the first daily high and the first daily low and adding it to the breakout point). This is a theoretical target, and traders could realize some profits around the weekly level of $709.29 and at the Feburary 13 high of $732.

The Relative Strength Index (RSI) on the daily chart reads 61 points upward, indicating strong bullish momentum while still below overbought levels. However, the Moving Average Convergence Divergence (MACD) indicator on the daily chart converges, indicating indecisiveness among the traders.
BNB/USDT daily chart

BNB/USDT daily chart

If BNB faces a pullback, it could extend the decline to retest its next daily support at $638.68. A close above this level would invalidate the bullish thesis, with next support located at the May 5 low of $583.55.

ข้อจำกัดความรับผิดชอบ: เพื่อการอ้างอิงเท่านั้น ผลการดำเนินงานในอดีตไม่ได้บ่งบอกถึงผลลัพธ์ในอนาคต
placeholder
คว้าโอกาสในการกู้คืนชิป: หุ้น Semiconductor 10 ตัวที่น่าลงทุนในปี 2566หากปี 2564 เป็นปีเก็บเกี่ยวของนักลงทุน semiconductor หลังจากประสบปัญหาผลประกอบการตกต่ำในปี 2565 ที่ผ่านมานี้ นักลงทุนจะลงทุนในหุ้นเซมิคอนดักเตอร์ในปี 2566 อย่างไร บทความนี้มีคำตอบ หุ้นเซมิคอนดักเตอร์ 10 ตัวที่ควรค่าแก่การลงทุน
ผู้เขียน  Mitrade
วันที่ 13 มิ.ย. 2023
หากปี 2564 เป็นปีเก็บเกี่ยวของนักลงทุน semiconductor หลังจากประสบปัญหาผลประกอบการตกต่ำในปี 2565 ที่ผ่านมานี้ นักลงทุนจะลงทุนในหุ้นเซมิคอนดักเตอร์ในปี 2566 อย่างไร บทความนี้มีคำตอบ หุ้นเซมิคอนดักเตอร์ 10 ตัวที่ควรค่าแก่การลงทุน
placeholder
BTC ทะลุระดับ 45,000 ดอลลาร์สหรัฐฯ อย่างกะทันหัน จะได้เห็นตลาด BTC ไปที่จุดสูงสุดถัดไปที่ 48,000 ดอลลาร์สหรัฐฯ หรือ 50,000 ดอลลาร์สหรัฐฯ หรือไม่ BTC ทะลุ 45,000 ดอลลาร์อย่างแข็งแกร่ง และเป้าหมายต่อไปจะเป็นอย่างไร?
ผู้เขียน  Mitrade
วันที่ 04 ม.ค. 2024
BTC ทะลุ 45,000 ดอลลาร์อย่างแข็งแกร่ง และเป้าหมายต่อไปจะเป็นอย่างไร?
placeholder
การคาดการณ์ราคา USDJPY: พบกับความยากลำบากที่ระดับ 144.00 และร่วงลง เนื่องจากทรัมป์โจมตีพาวเวลอีกครั้งคู่ USDJPY ปรับตัวขึ้นเล็กน้อยในวันพุธ โดยปิดเพิ่มขึ้น 0.18% สิ้นสุดการซื้อขายต่ำกว่า 143.70 ขณะที่การซื้อขายในตลาดลงทุนเอเชียวันพฤหัสบดีเริ่มต้นขึ้น คู่สกุลเงินนี้เคลื่อนไหวอยู่ที่ 143.63 แทบไม่เปลี่ยนแปลง
ผู้เขียน  FXStreet
7 เดือน 03 วัน พฤหัส
คู่ USDJPY ปรับตัวขึ้นเล็กน้อยในวันพุธ โดยปิดเพิ่มขึ้น 0.18% สิ้นสุดการซื้อขายต่ำกว่า 143.70 ขณะที่การซื้อขายในตลาดลงทุนเอเชียวันพฤหัสบดีเริ่มต้นขึ้น คู่สกุลเงินนี้เคลื่อนไหวอยู่ที่ 143.63 แทบไม่เปลี่ยนแปลง
placeholder
ราคาทองคำปรับตัวลดลงจากข้อตกลงการค้าระหว่างสหรัฐฯ-เวียดนาม โดยมี NFP เป็นจุดสนใจราคาทองคํา (XAU/USD) ดึงดูดผู้ขายบางส่วนในช่วงเซสชันเอเชียวันพฤหัสบดี และในขณะนี้ดูเหมือนว่าจะหยุดการปรับตัวขึ้นที่มีอายุสามวันจากระดับต่ำสุดในรอบหนึ่งเดือนที่แตะเมื่อช่วงต้นสัปดาห์นี้ ข้อตกลงการค้าระหว่างสหรัฐฯ และเวียดนามช่วยบรรเทาความกังวลเกี่ยวกับความตึงเครียดทางการค้าที่ยืดเยื้อ
ผู้เขียน  FXStreet
7 เดือน 03 วัน พฤหัส
ราคาทองคํา (XAU/USD) ดึงดูดผู้ขายบางส่วนในช่วงเซสชันเอเชียวันพฤหัสบดี และในขณะนี้ดูเหมือนว่าจะหยุดการปรับตัวขึ้นที่มีอายุสามวันจากระดับต่ำสุดในรอบหนึ่งเดือนที่แตะเมื่อช่วงต้นสัปดาห์นี้ ข้อตกลงการค้าระหว่างสหรัฐฯ และเวียดนามช่วยบรรเทาความกังวลเกี่ยวกับความตึงเครียดทางการค้าที่ยืดเยื้อ
placeholder
WTI สั่นไหวรอบ ๆ 66 ดอลลาร์ ขณะที่เส้นตายภาษีของทรัมป์ใกล้เข้ามาในตลาดลงทุนยุโรปวันศุกร์ ราคาน้ำมันดิบเวสต์เทกซัสอินเตอร์มีเดียต (WTI) ฟิวเจอร์สใน NYMEX ซื้อขายอย่างระมัดระวังใกล้ระดับ 66.00 ดอลลาร์
ผู้เขียน  FXStreet
7 เดือน 04 วัน ศุกร์
ในตลาดลงทุนยุโรปวันศุกร์ ราคาน้ำมันดิบเวสต์เทกซัสอินเตอร์มีเดียต (WTI) ฟิวเจอร์สใน NYMEX ซื้อขายอย่างระมัดระวังใกล้ระดับ 66.00 ดอลลาร์
ตราสารที่เกี่ยวข้อง
goTop
quote