


BNB Price Forecast: Derivatives back bullish upside continuation
- BNB edges slightly down, trading around $790 on Monday after posting three consecutive weekly gains.
- Rising open interest and positive funding rates indicate strengthening bullish positioning.
- The constructive technical outlook supports further gains, though institutional demand remains muted.
BNB (BNB), formerly known as Binance Coin, edges lower, trading around $790 on Monday after posting three consecutive weekly gains. Rising Open Interest (OI) and positive funding rates suggest that bullish positioning is strengthening in the derivatives market. However, muted spot Exchange-Traded Fund (ETF) flows indicate institutional demand remains limited, suggesting traders should remain cautious about the rally's sustainability.
Derivatives signal bullish upside continuation
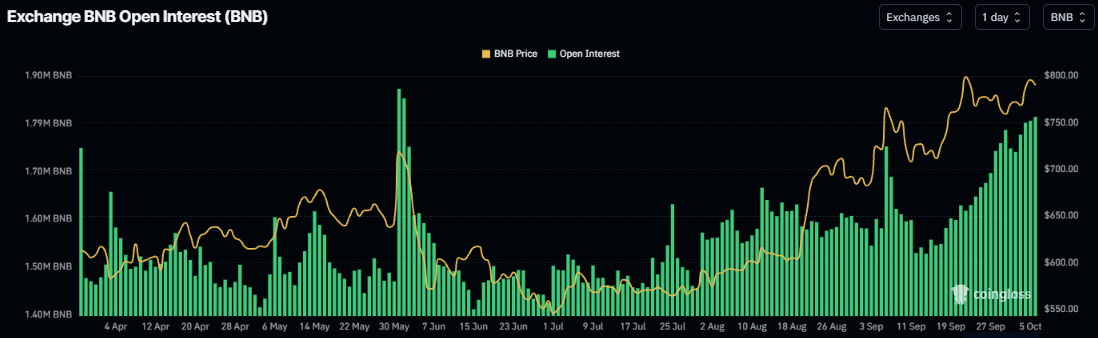
BNB's derivatives metrics show strengthening conditions. CoinGlass' Open Interest (OI) chart for BNB has surged across exchanges since mid-September, with outstanding contracts reaching 1.81 billion BNB on Monday, the highest level since early June. The increase in OI alongside rising prices suggests that new long positions are entering the market, signaling a bullish outlook.
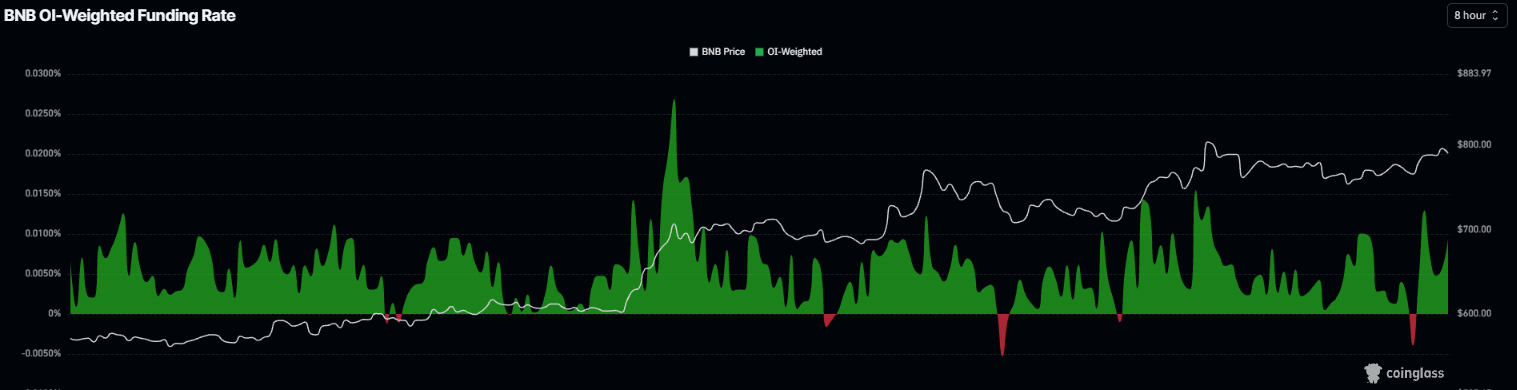
In addition, BNB's funding rate flipped positive on Saturday and rose to 0.0093% on Monday. This indicates longs are paying shorts, reflecting a bullish outlook for BNB.
Silent institutional demand
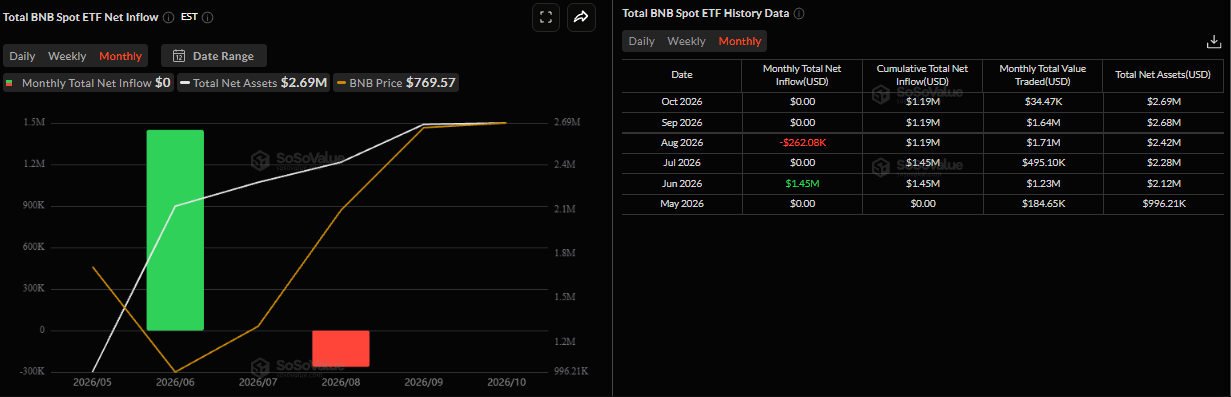
SoSoValue data shows that BNB's spot Exchange-Traded Funds (ETFs) have remained largely silent since their launch on May 28, indicating a lack of meaningful institutional demand for the token. Moreover, investor activity also remained subdued through September and into October, suggesting the recent BNB rally has been driven primarily by derivatives. However, a sustained shift toward positive ETF flows could signal rising institutional interest and support further upside for BNB.
BNB technical outlook: Closing above $798 resistance suggests further gains
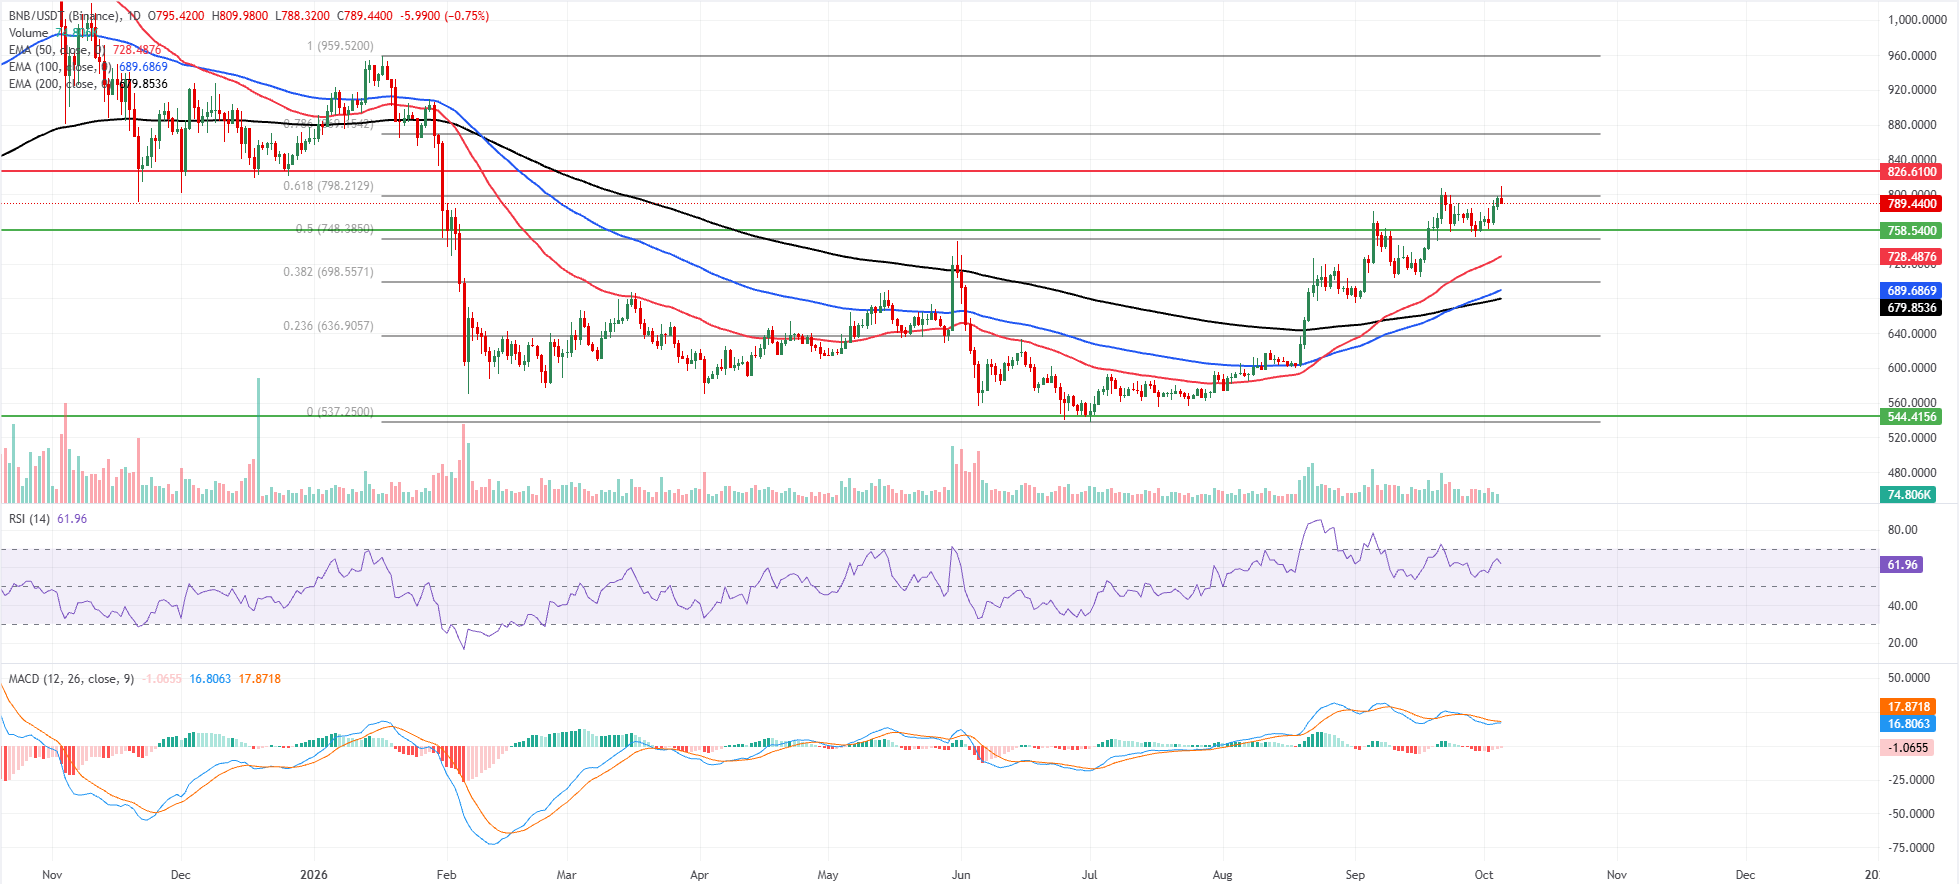
BNB price trades around $790 on Monday, holding a bullish near-term bias as it remains well above the 50-day, 100-day, and 200-day Exponential Moving Average (EMA) at $728, $689, and $679, respectively. BNB is consolidating just under the 61.8% Fibonacci retracement at $798, suggesting topside pressure but still within an overall supported structure.
The Relative Strength Index (RSI) at 61 stays in bullish territory without being overbought, while the Moving Average Convergence Divergence (MACD) indicator hovers slightly negative, hinting that momentum is constructive but not yet impulsive.
On the downside, initial support appears at the recent horizontal level near $758, followed by the 50% retracement at $748 and the 50-day EMA at $728, forming a broader demand band on minor pullbacks.
On the topside, a decisive break above the 61.8% retracement at $798 would open the way toward horizontal resistance at $826, with the cycle high at $959 acting as the next major bullish objective.
(The technical analysis of this story was written with the help of an AI tool. Know more.)
บทความแนะนำ


