Top trending meme coins PEPE, BOME, TRUMP: Bearish signs persist
- Pepe price encounters resistance from a descending trendline.
- BOOK OF MEME price finds support at the weekly level of $0.00944.
- TRUMP price finds support along an ascending trendline.
Pepe (PEPE) price has encountered resistance at a critical level, whereas Trump (MAGA) and Book of Meme (BOME) are testing crucial support levels. The technical outlook suggests potential short-term corrections for PEPE and BOME, while MAGA appears poised for a rally.
Pepe price eyes for a short-term fall
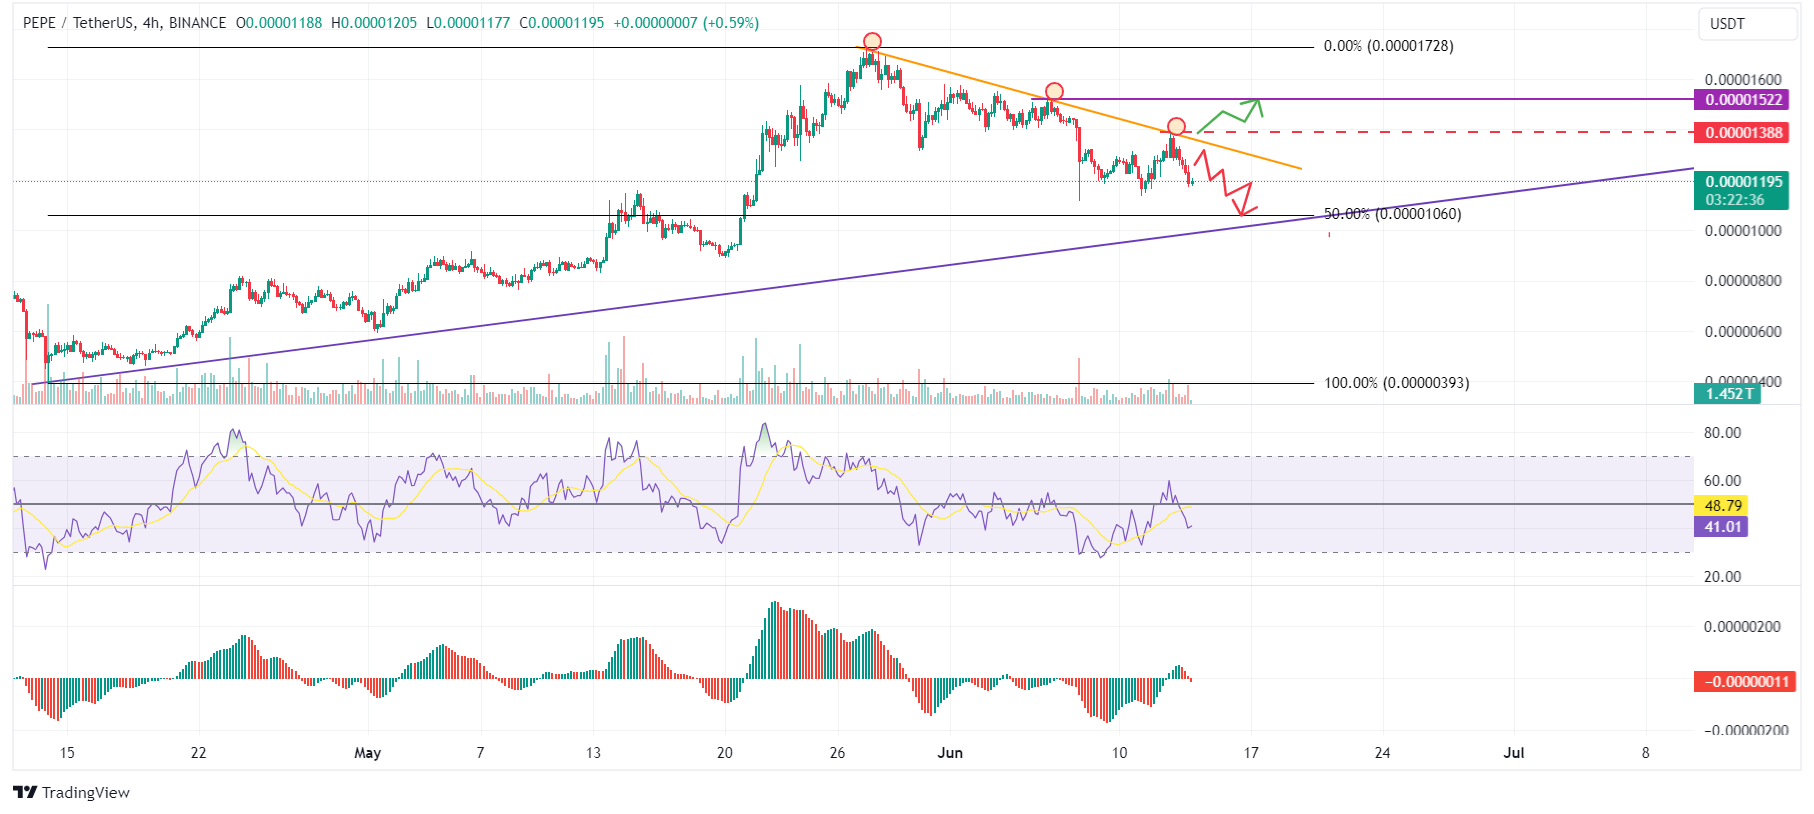
Pepe price currently faces resistance by a descending trendline drawn from joining three swing high points from the end of May to mid-June, as shown in the four-hour chart.
If this trendline holds as resistance, then PEPE could crash around 14% from its current trading price of $0.0000119 to $0.0000106, the 50% price retracement of the $0.0000039 to $0.0000172 up move.
The Relative Strength Index (RSI) and the Awesome Oscillator (AO) on the four-hour chart support this bearish scenario, as both indicators are below their respective mean levels of 50 and 0.
This suggests the exhaustion among bulls and continued momentum favoring bears, potentially leading to a further decline in PEPE's price.

PEPE/USDT 4-hour chart
On the other hand, if Pepe’s price closes above $0.0000138, it would invalidate the bearish thesis by producing a higher high in the daily time frame, leading PEPE to rally 10% and hitting the previous daily high of $0.0000152 on June 6.
BOOK OF MEME price set to retest lows
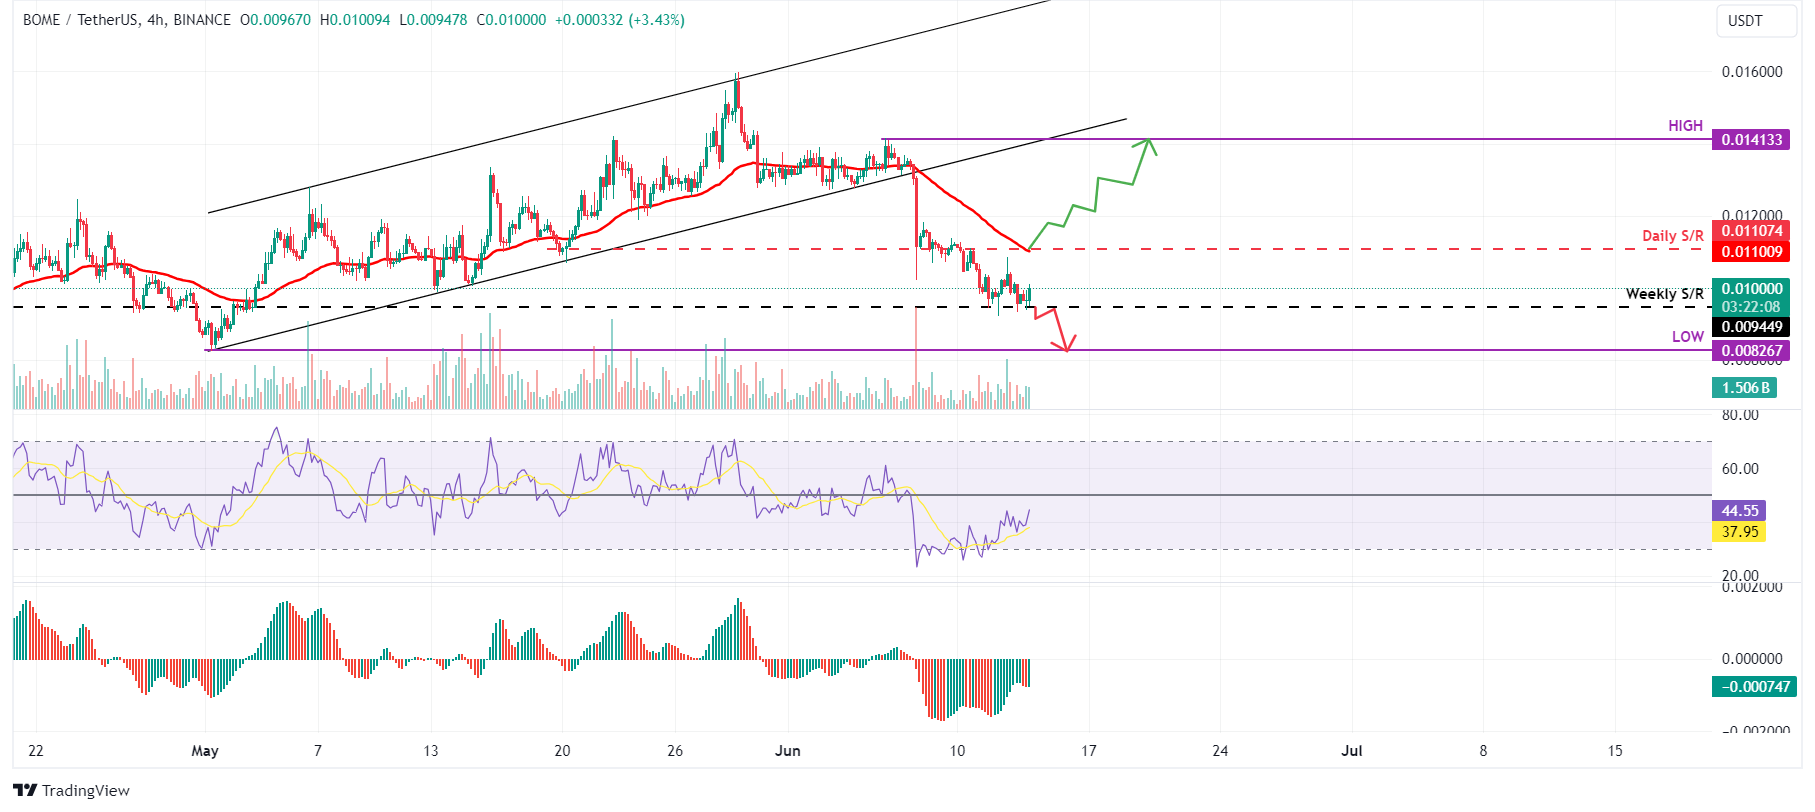
BOME price current stability hinges on the $0.00944 weekly support, but a breach below could trigger a 13% plunge to revisit its May 1 low of $0.00826.
The Relative Strength Index (RSI) and the Awesome Oscillator (AO) on the four-hour chart support this bearish scenario, as both indicators are below their respective mean levels of 50 and 0.
This suggests the exhaustion among bulls and continued momentum favoring bears, potentially leading to a further decline in BOME's price.

BOME/USDT 4-hour chart
However, if the BOME daily candlestick closes above the $0.0111 daily resistance level and flips it in support, and the RSI and AO surge above their mean levels of 50 and 0, then a pivotal market shift from bearish to bullish could transpire.
This structural change would be marked by BOME forming a higher high in the daily timeframe. In such an event, BOME could potentially rally by 27%, aiming to retest its June 6 high of $0.014133.
TRUMP price shows potential
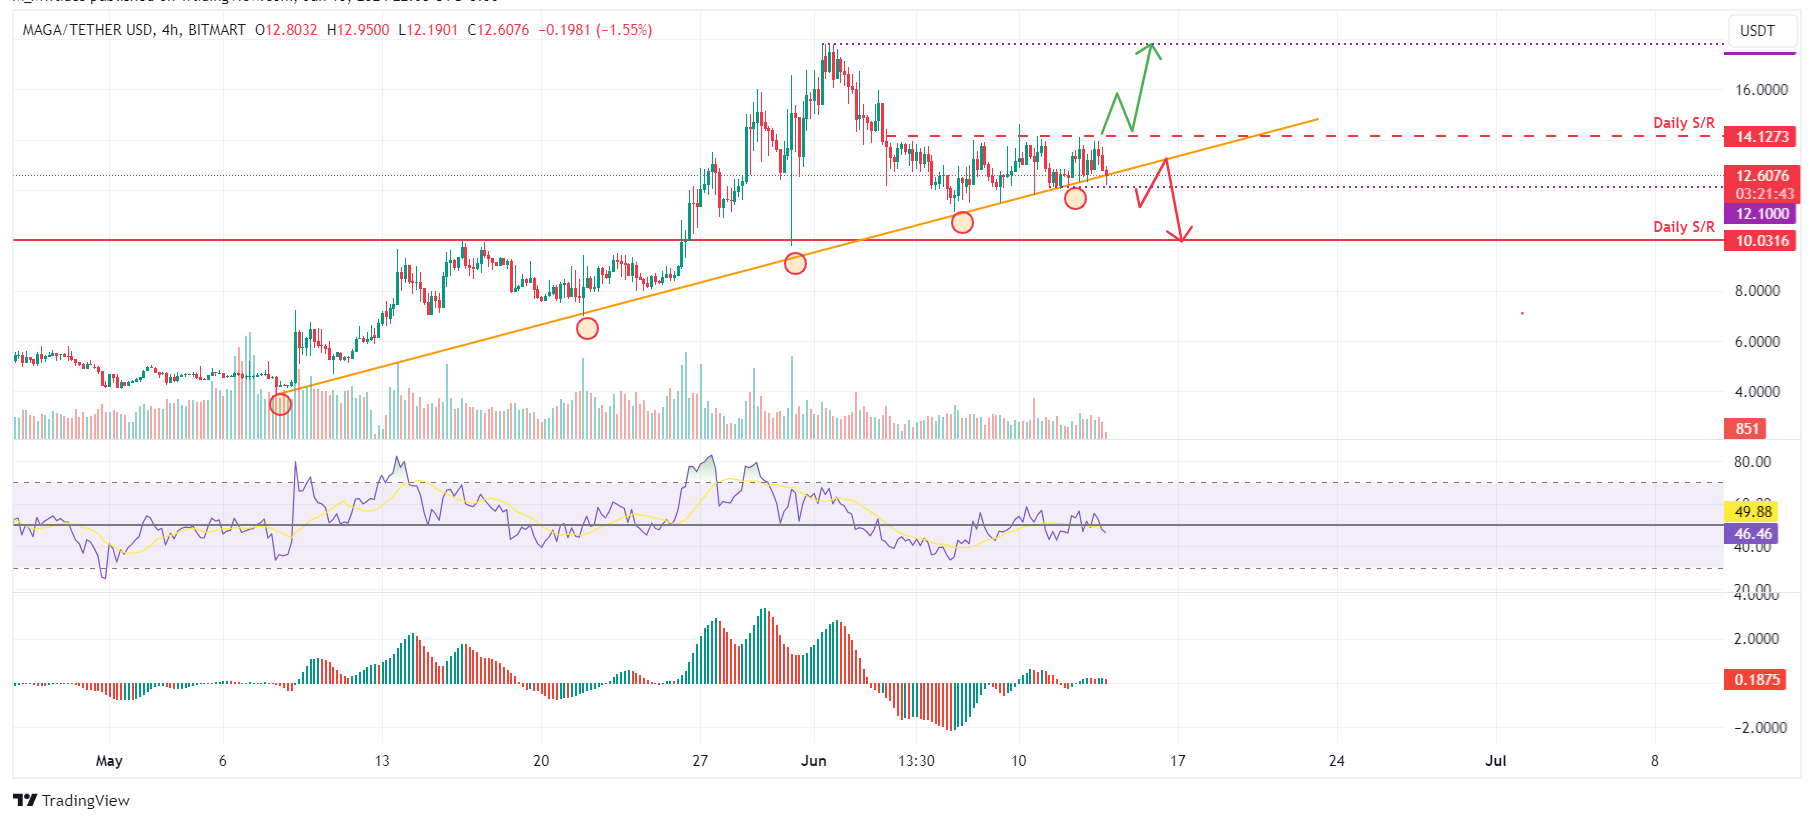
MAGA price (TRUMP) finds support around an ascending trendline drawn from joining multiple swing low points from May to June, as shown in the four-hour chart. If this support holds and TRUMP’s price closes above the $14.127 daily resistance level, then it could rally 25% to tag the daily high of $17.79 on June 1.
The Relative Strength Index (RSI) and the Awesome Oscillator (AO) on the four-hour chart support this bullish outlook by both being above the mean levels of 50 and 0, indicating that bulls still have steam to push TRUMP's price higher.

TRUMP/USDT 4-hour chart
On the other hand, if MAGA's daily candlestick breaks below the trendline and closes below the $12.10 level, it would produce a lower low and signal a break in the market structure. This move would invalidate the aforementioned bullish thesis, potentially triggering a 17% crash to the daily support level of $10.03.


