

Solana Price Prediction: SOL lacks directional move amid weak demand

แหล่งที่มา Fxstreet
  • Solana hovers above $75 on Monday, testing its 50-day EMA at $76.54 after a 3% surge the previous day.
  • SOL-focused ETFs recorded $7.20 million in inflows, marking their fourth consecutive week of inflows.
  • Derivatives market signals mixed demand for SOL as Open Interest eases amid a positive spike in the funding rate.

Solana (SOL) price edges lower on Monday, following a 3% recovery the previous day. Institutional investors show mild demand for SOL with $7.20 million in inflows last week, but retail demand is mixed with declining Open Interest despite a positive surge in the funding rate.

The technical outlook for SOL is mixed, with price consolidating within a symmetrical triangle pattern as momentum wanes. 

Demand remains mixed for SOL

Institutional interest in Solana remains muted, while retail activity shows mixed sentiment. SoSoValue data show that the SOL-focused ETFs recorded $7.20 million in inflows last week, bringing total inflows to $11.80 million so far in June. This marks the fourth consecutive weekly inflow in SOL ETFs, but remains subdued compared to over $20 million in weekly inflows seen earlier this year.

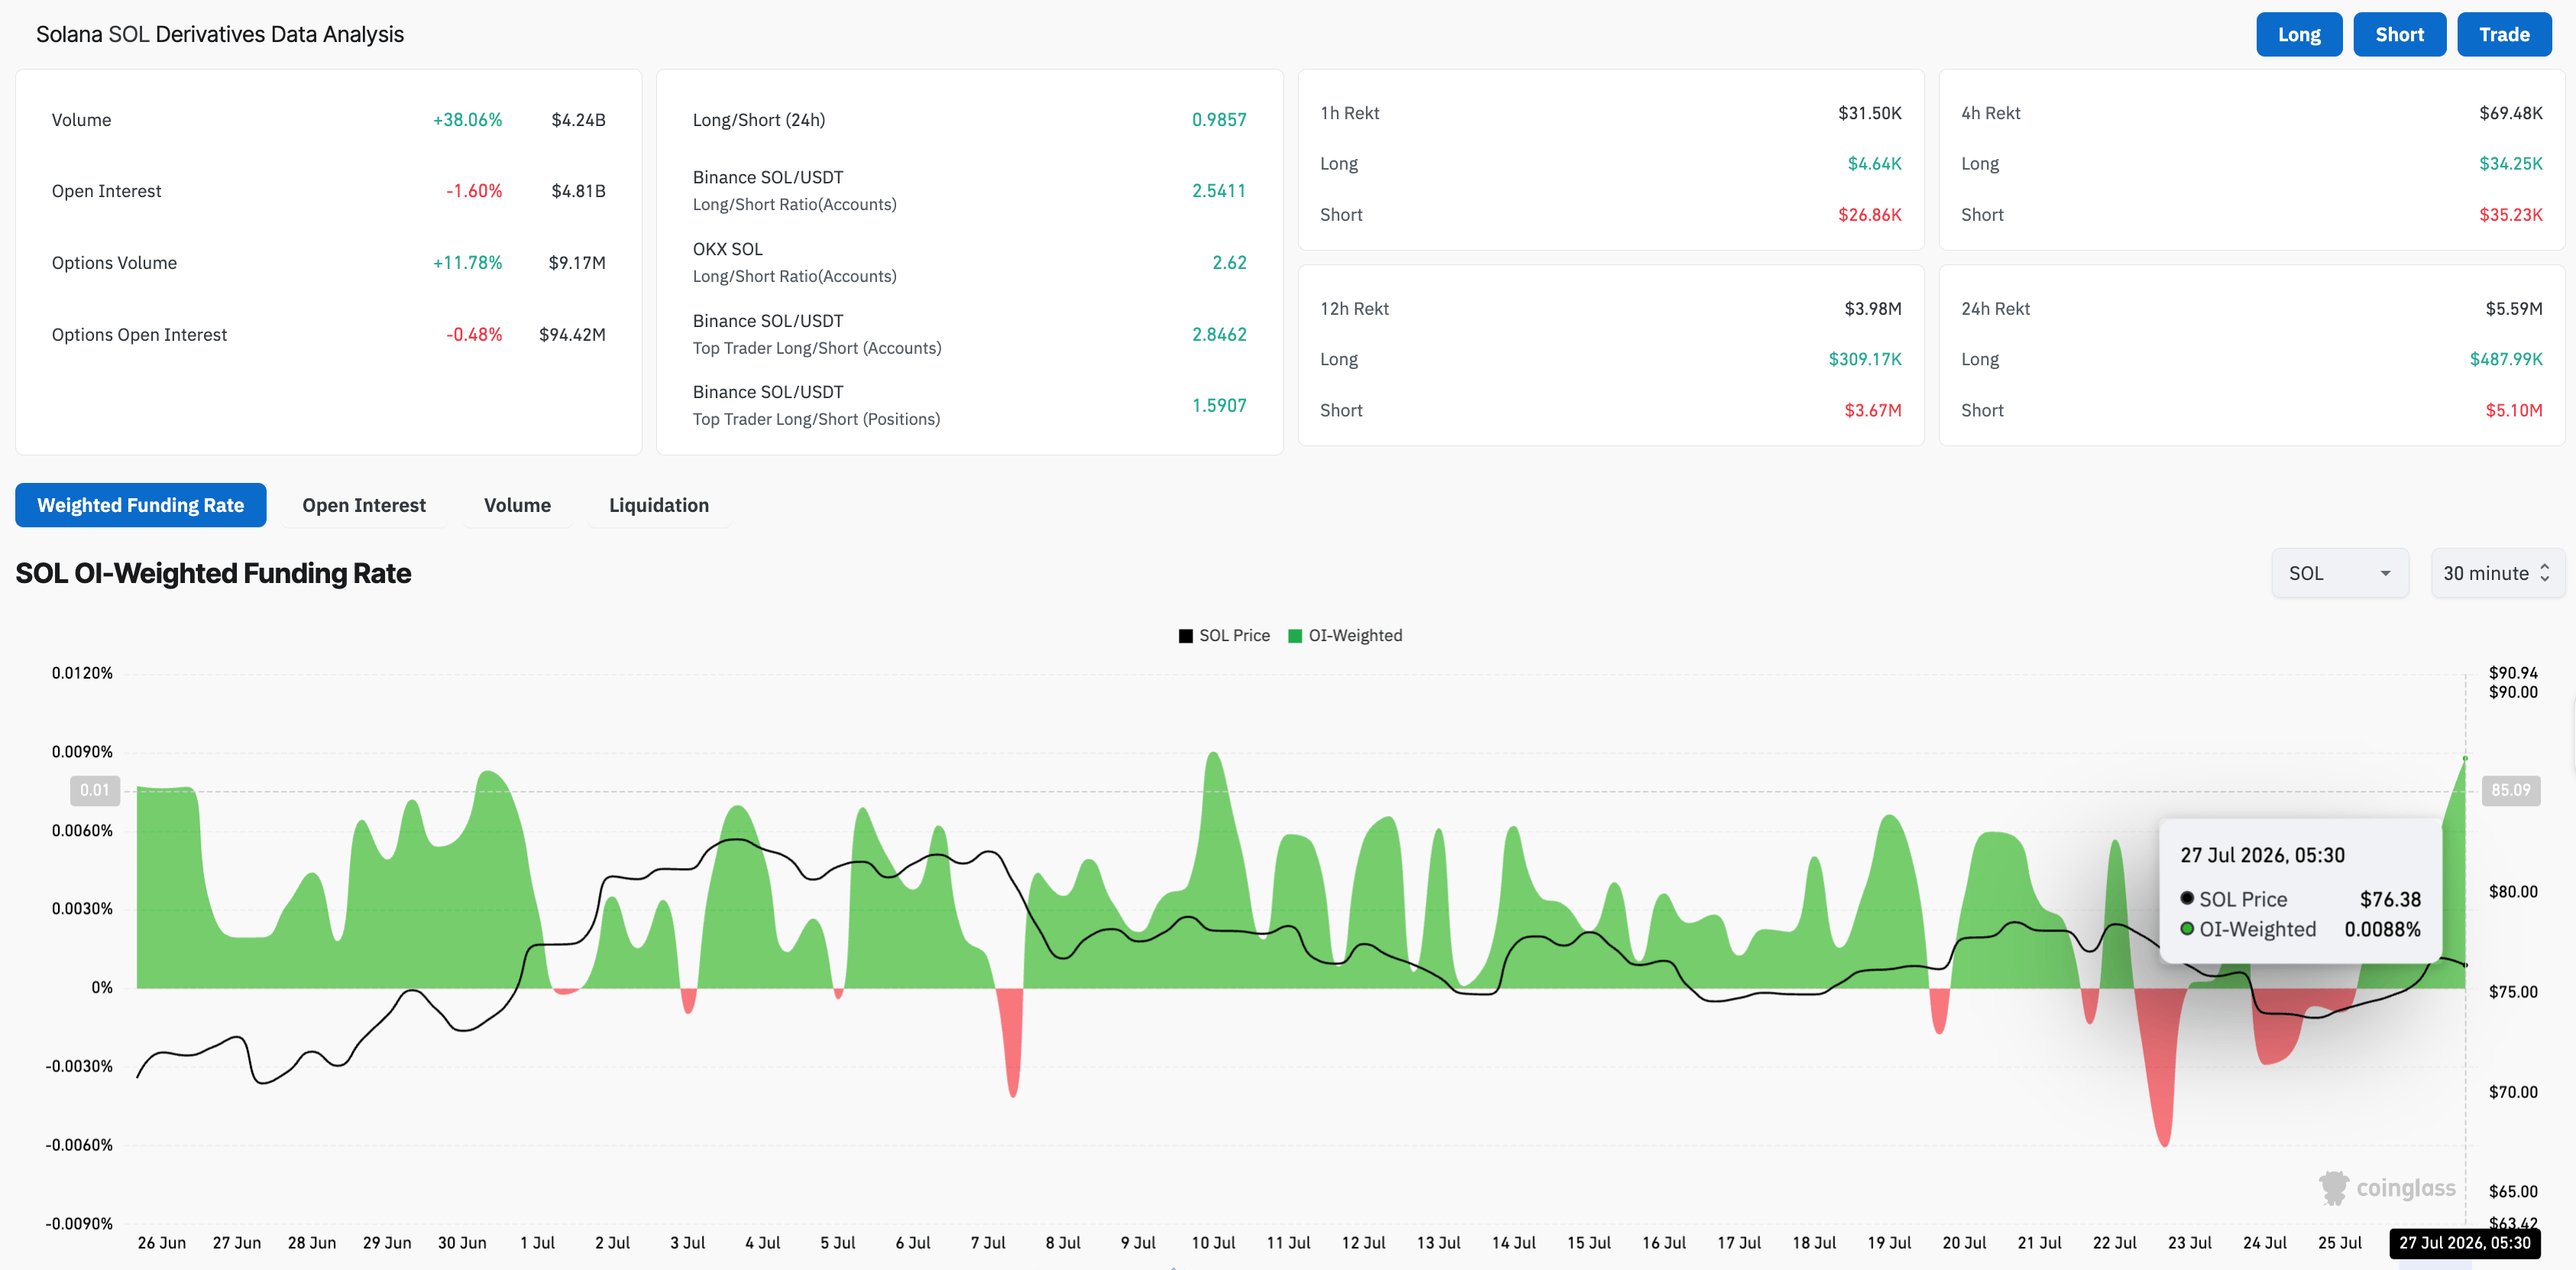
On the retail front, CoinGlass data shows the SOL Open Interest (OI) has contracted by 1.60% over the last 24 hours to $4.81 billion, while volume has increased by 38% to $4.24 billion. This suggests that retail activity is rising while the highly leveraged positional buildup is being trimmed.

At the same time, the positive spike in the funding rate to 0.0088%, up from 0.0060% the previous day, indicates that renewed retail activity prefers to acquire long positions at a premium.
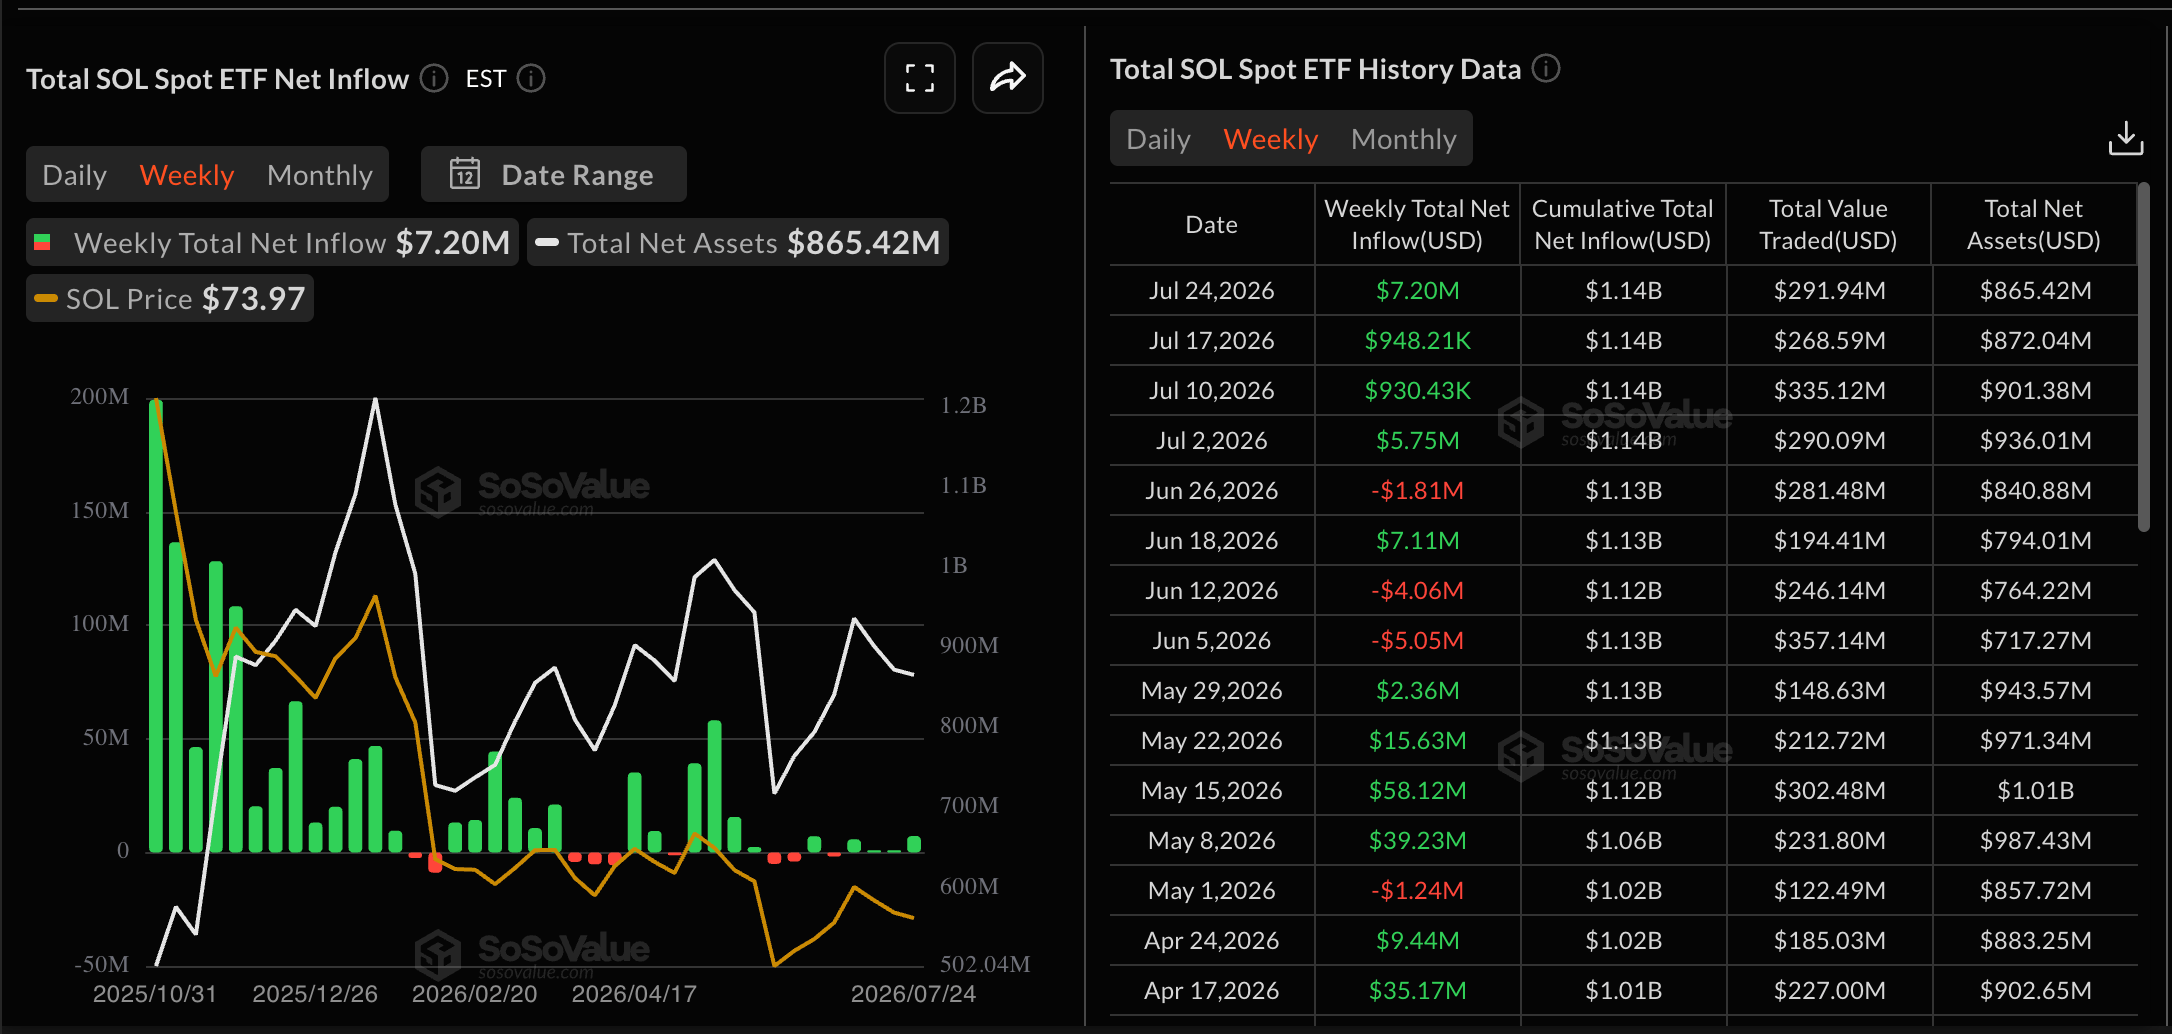
SOL ETFs data. Source: Sosovalue
SOL derivatives data. Source: CoinGlass

Will SOL price rise above $80?

Solana price tests the 50-day Exponential Moving Average (EMA) at $76.54 on Monday, following a 3% recovery the previous day. The price is well below the 200-day EMA at $92.36, which together suggests a still-fragile broader trend.

From a technical perspective, the downward resistance trendline near $78.29 reinforces the cluster of supply above spot. In addition, the 50% retracement level, measured over the recent downswing from $98.41 to $60.13, at $79.27, strengthens the overhead barrier. To reinstate a steady recovery, SOL must clear $80.00 with a sustained breakout, potentially targeting the 78.6% Fibonacci retracement level at $90.21.

Momentum is mixed, with the Relative Strength Index (RSI) hovering around the neutral 50 mark and the Moving Average Convergence Divergence (MACD) marginally below the signal line, but the negative histogram contracts, hinting that bearish pressure is easing rather than decisively reversing.

Chart Analysis SOL/USDT (Binance)
SOL/USDT daily price chart.

On the downside, initial support is seen at the rising support trendline near $70.86. A break below there would open the way toward the 23.6% retracement at $69.16 and the prior cycle low region around $60.13.

(The technical analysis of this story was written with the help of an AI tool. Know more.)

ข้อจำกัดความรับผิดชอบ: เพื่อการอ้างอิงเท่านั้น ผลการดำเนินงานในอดีตไม่ได้บ่งบอกถึงผลลัพธ์ในอนาคต
placeholder
ราคาทองคำพุ่งขึ้นท่ามกลางการโจมตีในสงครามอ่าวและดอลลาร์สหรัฐที่แข็งแกร่งราคาทองคำพุ่งขึ้นในวันอังคารในช่วงเซสชันอเมริกาเหนือ เพิ่มขึ้นมากกว่า 1.50% ท่ามกลางการโจมตีด้วยขีปนาวุธอย่างต่อเนื่องระหว่างสหรัฐฯ และอิหร่าน แม้จะมีความพยายามของตัวกลางในการยุติสงคราม XAU/USD ซื้อขายที่ $4,071
ผู้เขียน  FXStreet
7 เดือน 22 วัน พุธ
ราคาทองคำพุ่งขึ้นในวันอังคารในช่วงเซสชันอเมริกาเหนือ เพิ่มขึ้นมากกว่า 1.50% ท่ามกลางการโจมตีด้วยขีปนาวุธอย่างต่อเนื่องระหว่างสหรัฐฯ และอิหร่าน แม้จะมีความพยายามของตัวกลางในการยุติสงคราม XAU/USD ซื้อขายที่ $4,071
placeholder
ราคาทองคําปรับตัวลดลงต่อเนื่องเนื่องจากความกังวลเงินเฟ้อหนุนการเก็งการขึ้นดอกเบี้ยของเฟดและค่าเงินดอลลาร์สหรัฐท่ามกลางมาตรการทองคํา (XAU/USD) ดึงดูดผู้ขายเป็นวันที่สองติดต่อกันในวันศุกร์และอ่อนค่าลงต่อเนื่องต่ำกว่าระดับราคา $4,050 ในช่วงเซสชันเอเชีย
ผู้เขียน  FXStreet
7 เดือน 24 วัน ศุกร์
ทองคํา (XAU/USD) ดึงดูดผู้ขายเป็นวันที่สองติดต่อกันในวันศุกร์และอ่อนค่าลงต่อเนื่องต่ำกว่าระดับราคา $4,050 ในช่วงเซสชันเอเชีย
placeholder
WTI ยังคงถูกขายออกอย่างหนักใกล้ระดับ 84.00 ดอลลาร์ ท่ามกลางความหวังในการลดความตึงเครียดในความขัดแย้งระหว่างสหรัฐฯ กับอิหร่านน้ำมัน West Texas Intermediate (WTI) ซึ่งเป็นเกณฑ์มาตรฐานราคาน้ำมันดิบของสหรัฐฯ เปิดตลาดด้วยช่องว่างราคาขาลงในช่วงต้นสัปดาห์ใหม่ และปรับตัวลดลงต่อจากระดับสูงสุดนับตั้งแต่วันที่ 8 มิถุนายน ที่บริเวณระดับ 92.25 ดอลลาร์ ซึ่งแตะเมื่อวันพฤหัสบดีที่ผ่านมา
ผู้เขียน  FXStreet
5 ชั่วโมงที่แล้ว
น้ำมัน West Texas Intermediate (WTI) ซึ่งเป็นเกณฑ์มาตรฐานราคาน้ำมันดิบของสหรัฐฯ เปิดตลาดด้วยช่องว่างราคาขาลงในช่วงต้นสัปดาห์ใหม่ และปรับตัวลดลงต่อจากระดับสูงสุดนับตั้งแต่วันที่ 8 มิถุนายน ที่บริเวณระดับ 92.25 ดอลลาร์ ซึ่งแตะเมื่อวันพฤหัสบดีที่ผ่านมา
placeholder
ทองคำปรับตัวขึ้นเล็กน้อยเนื่องจากการทูตระหว่างสหรัฐฯ-อิหร่านและราคาน้ำมันที่อ่อนแอส่งผลกดดันดอลลาร์สหรัฐก่อนการประชุม FOMCทองคำ (XAU/USD) เปิดตลาดด้วยช่องว่างราคาขาขึ้นในช่วงเริ่มต้นสัปดาห์ใหม่ แม้ว่าจะพยายามใช้ประโยชน์จากโมเมนตัม แต่ก็ยังไม่สามารถยืนเหนือระดับ $4,100 ได้ เนื่องจากฝั่งขาขึ้นดูเหมือนจะลังเลก่อนการประชุม FOMC ที่สำคัญซึ่งเริ่มในวันอังคาร
ผู้เขียน  FXStreet
2 ชั่วโมงที่แล้ว
ทองคำ (XAU/USD) เปิดตลาดด้วยช่องว่างราคาขาขึ้นในช่วงเริ่มต้นสัปดาห์ใหม่ แม้ว่าจะพยายามใช้ประโยชน์จากโมเมนตัม แต่ก็ยังไม่สามารถยืนเหนือระดับ $4,100 ได้ เนื่องจากฝั่งขาขึ้นดูเหมือนจะลังเลก่อนการประชุม FOMC ที่สำคัญซึ่งเริ่มในวันอังคาร
placeholder
ข่าวหุ้นวันนี้ น้ำมันเริ่มย่อช่วยตลาดหายใจ แต่ Fed กับงบ AI ยังเป็นด่านใหญ่ของตลาดทันทุกกระแสการเงิน สรุปข่าวเด่น Forex หุ้น ทองคำ คริปโตฯ และเศรษฐกิจรอบวัน วิเคราะห์แนวโน้มตลาดด้วยข้อมูลเชิงลึก อ่านง่าย เข้าใจไว อัปเดตล่าสุดที่นี่
ผู้เขียน  Mitrade
1 ชั่วโมงที่แล้ว
ทันทุกกระแสการเงิน สรุปข่าวเด่น Forex หุ้น ทองคำ คริปโตฯ และเศรษฐกิจรอบวัน วิเคราะห์แนวโน้มตลาดด้วยข้อมูลเชิงลึก อ่านง่าย เข้าใจไว อัปเดตล่าสุดที่นี่
ตราสารที่เกี่ยวข้อง
goTop
quote