


Crypto Today: Bitcoin, Ethereum, XRP edge higher as US government shutdown fears intensify
- Bitcoin rises toward $88,000 after a volatile last week and growing risks of another US government shutdown.
- Ethereum eyes a short-term breakout above $3,000 as bulls regain composure.
- XRP posts modest gains but remains below the 50-, 100-, and 200-day EMAs, preserving the overall bearish trend.
Bitcoin (BTC), Ethereum (ETH), and Ripple (XRP) are edging higher at the time of writing on Monday, as traders navigate mounting macroeconomic uncertainty and political risks amid the looming threat of another United States (US) government shutdown.
The flagship cryptocurrency is inching toward $88,000, seeking to regain momentum after a volatile week marked by sharp intraday swings and risk-off sentiment. Ethereum holds above $2,900 while XRP nears $1.90, signaling growing risk-on sentiment.
BTC, ETH and XRP rebound as markets weigh growing US government uncertainty
The odds of a partial US government shutdown by the end of the week have increased to 77% on the prediction platform Polymarket. The US Senate is expected to vote on a massive $1.2 trillion package to fund government operations; however, challenges are emerging as Democratic senators withdraw support amid pushback against federal immigration agents, CNBC reports.
The federal government will begin a partial shutdown on Friday if the Senate fails to approve the deal. The previous shutdown in the fourth quarter of 2025 lasted 43 days, the longest in history, stalling federal government operations.
Historically, government shutdowns have triggered risk-off sentiment across financial markets, with digital assets often bearing the brunt of volatility as investors flee to safer havens.
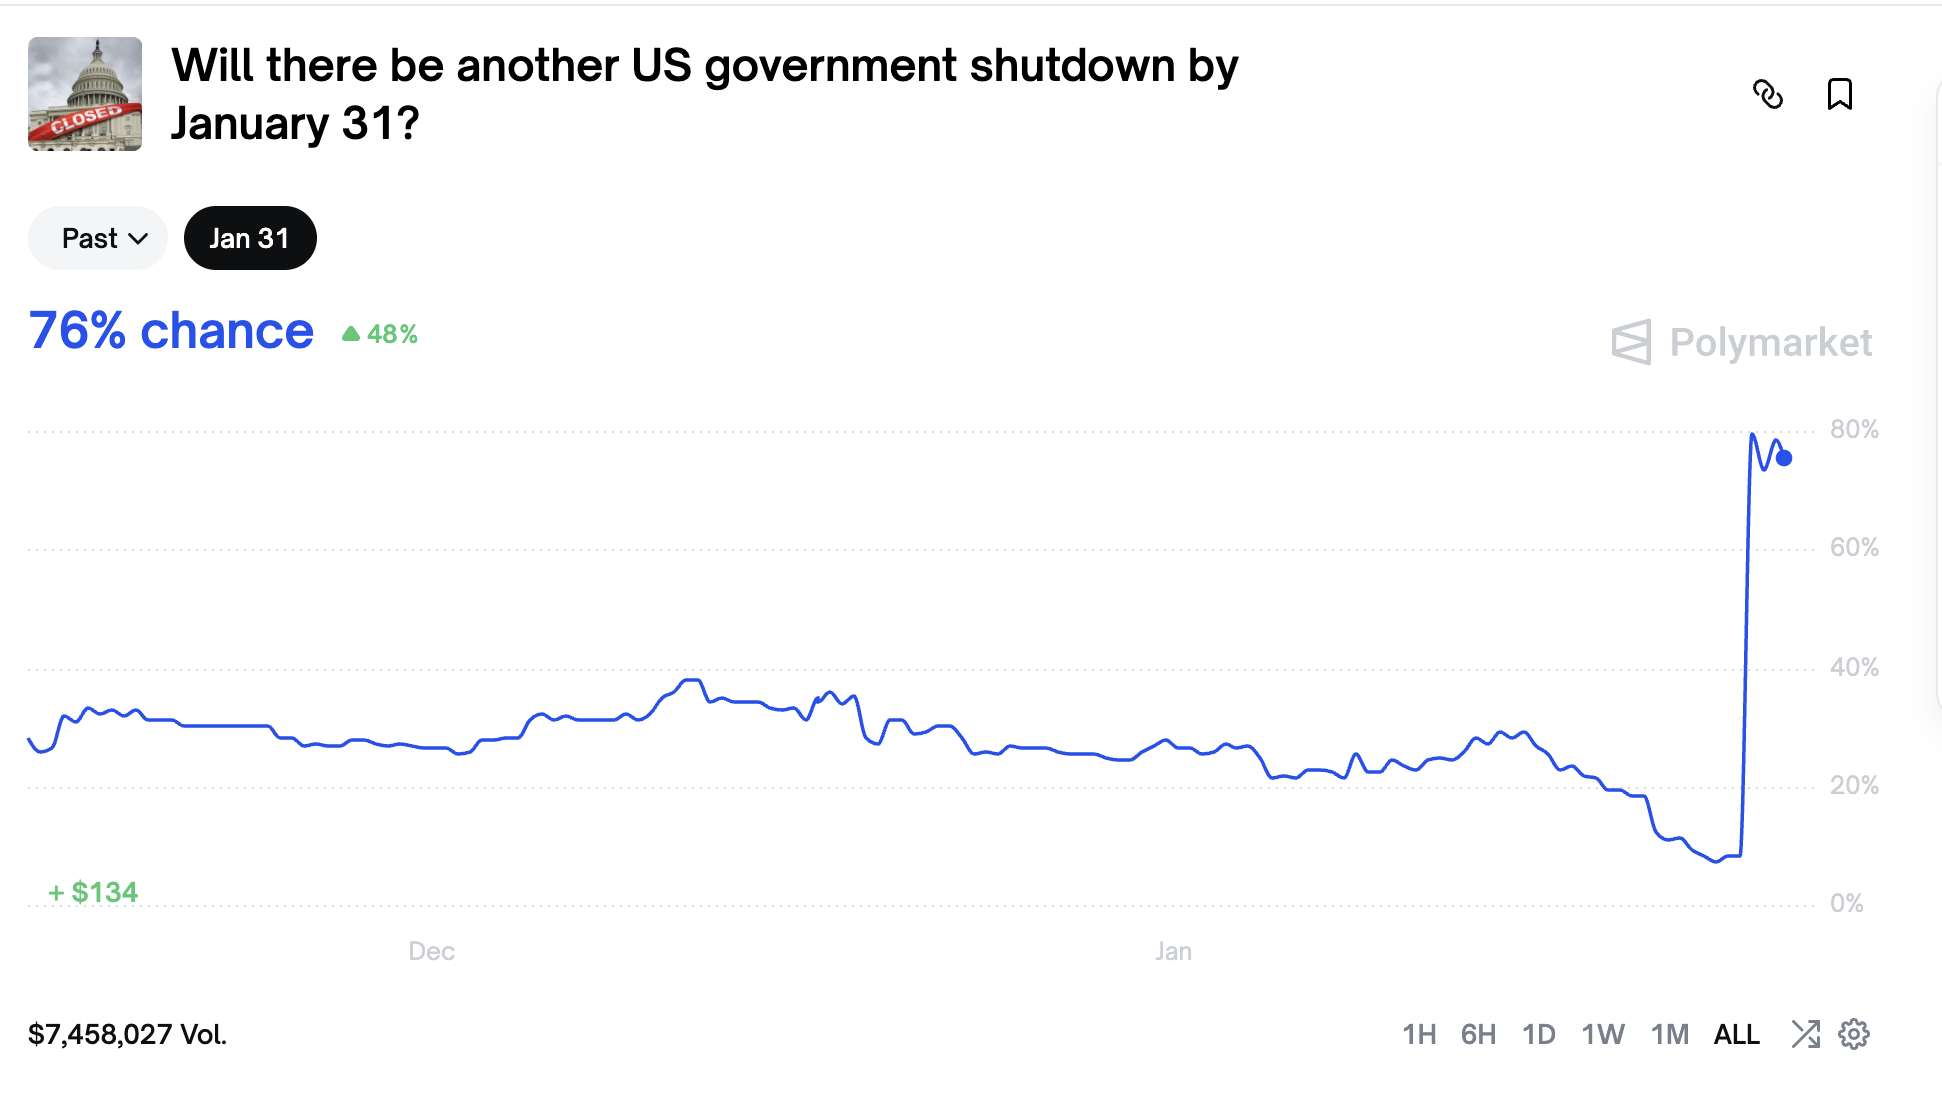
Chart of the day: Bitcoin rises as pressure eases slightly
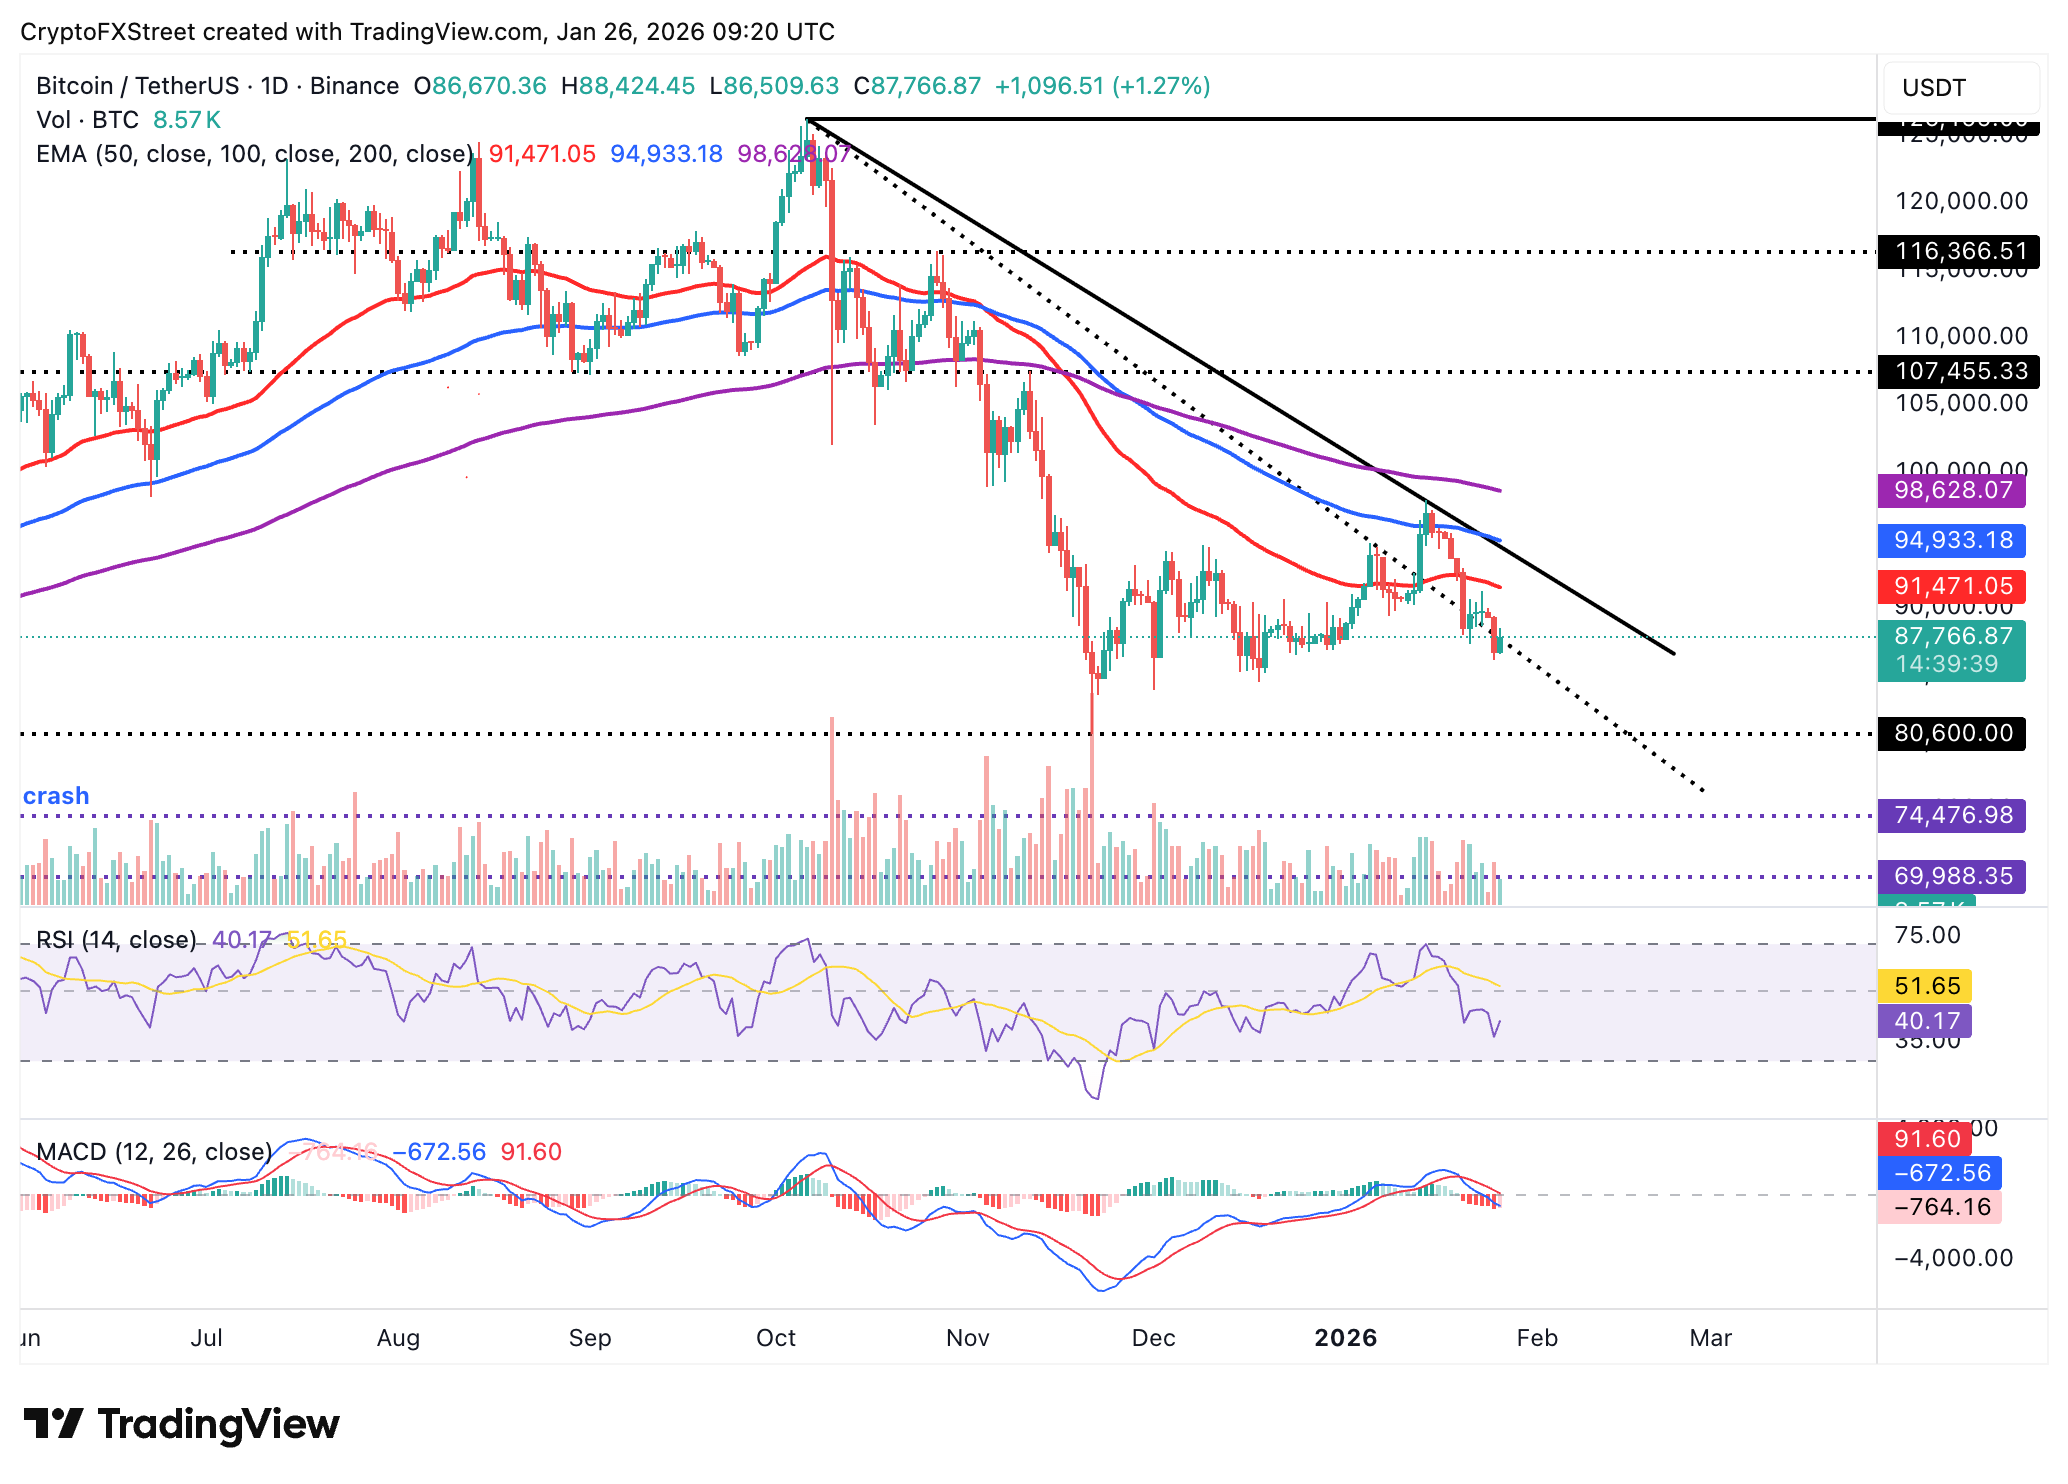
Bitcoin is eyeing a short-term breakout above $90,000, as bulls tighten their grip after last week’s intense volatility. The Relative Strength Index (RSI), which has risen to 40 on the daily chart, suggests that crypto bulls are attempting to hold key support levels. An increase in the RSI beyond the midline could signal a potential transition from bearish to bullish as Bitcoin navigates hurdles toward the psychological $100,000 level.
However, the Moving Average Convergence Divergence (MACD) indicator on the same chart holds below the signal line, confirming the overall bearish bias.
Bitcoin also sits below the 50-day Exponential Moving Average (EMA) at $91,470, the 100-day EMA at $94,933 and the 200-day EMA at 98,628, all of which reinforce the bearish grip. A close below $88,000 could encourage risk-off sentiment, leaving Bitcoin vulnerable to selling pressure toward the November low of $80,600.
Altcoins technical outlook: Ethereum, XRP exhibit short-term strength
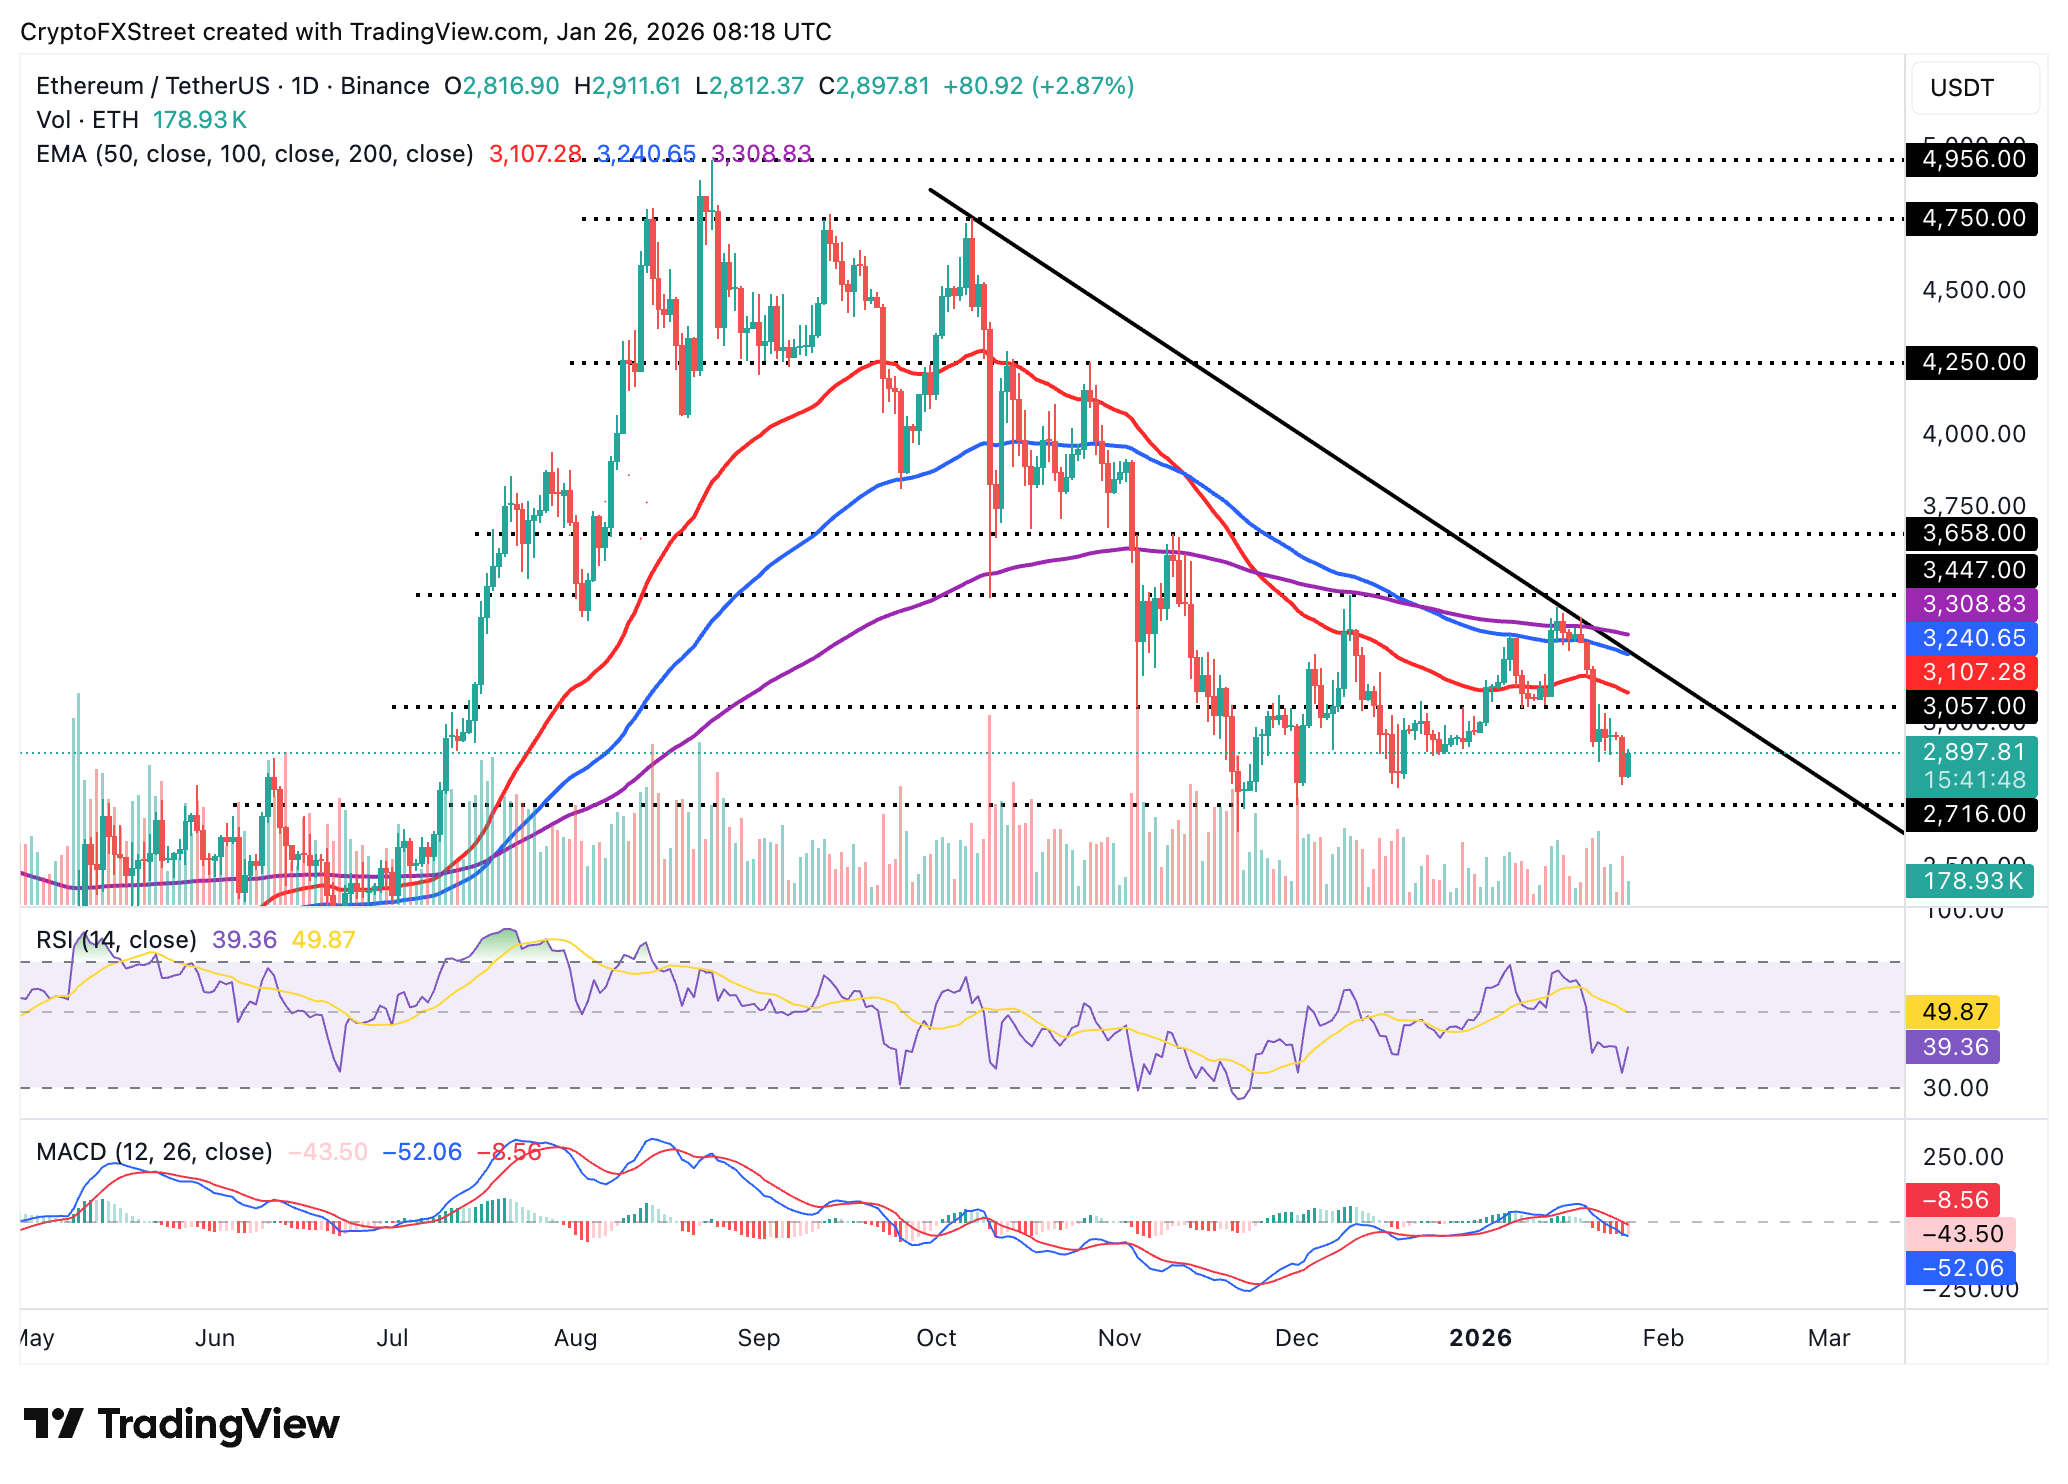
Ethereum is also nudging higher, hovering slightly above $2,900 as bulls mull a breakout past $3,000. The smart contract token’s short-term positive outlook is supported by the RSI’s recovery to 39 on the daily chart. A further increase in the RSI toward the midline would suggest that bearish momentum is fading, gradually paving the way for steady gains.
Still, a break above the 50-day EMA at $3,107 would be required to reinforce the bullish grip. Despite modest intraday gains, Ethereum is not out of the woods yet, as the MACD indicator on the same chart remains below the signal line. Histogram bars expanding below the zero line may prompt traders to reduce risk exposure, adding to the selling pressure. A reversal below Monday’s open at $2,817 would increase the risk of the downtrend’s continuation toward the December 1 support at $2,716.
Similarly, XRP is edging up toward a short-term hurdle at $1.90 while its intraday low provides support at $1.83. The RSI backs the positive outlook, rising above 40 on the daily chart and signalling easing bearish momentum. A steady increase above the midline would boost XRP’s recovery odds beyond the pivotal $2.00 level.
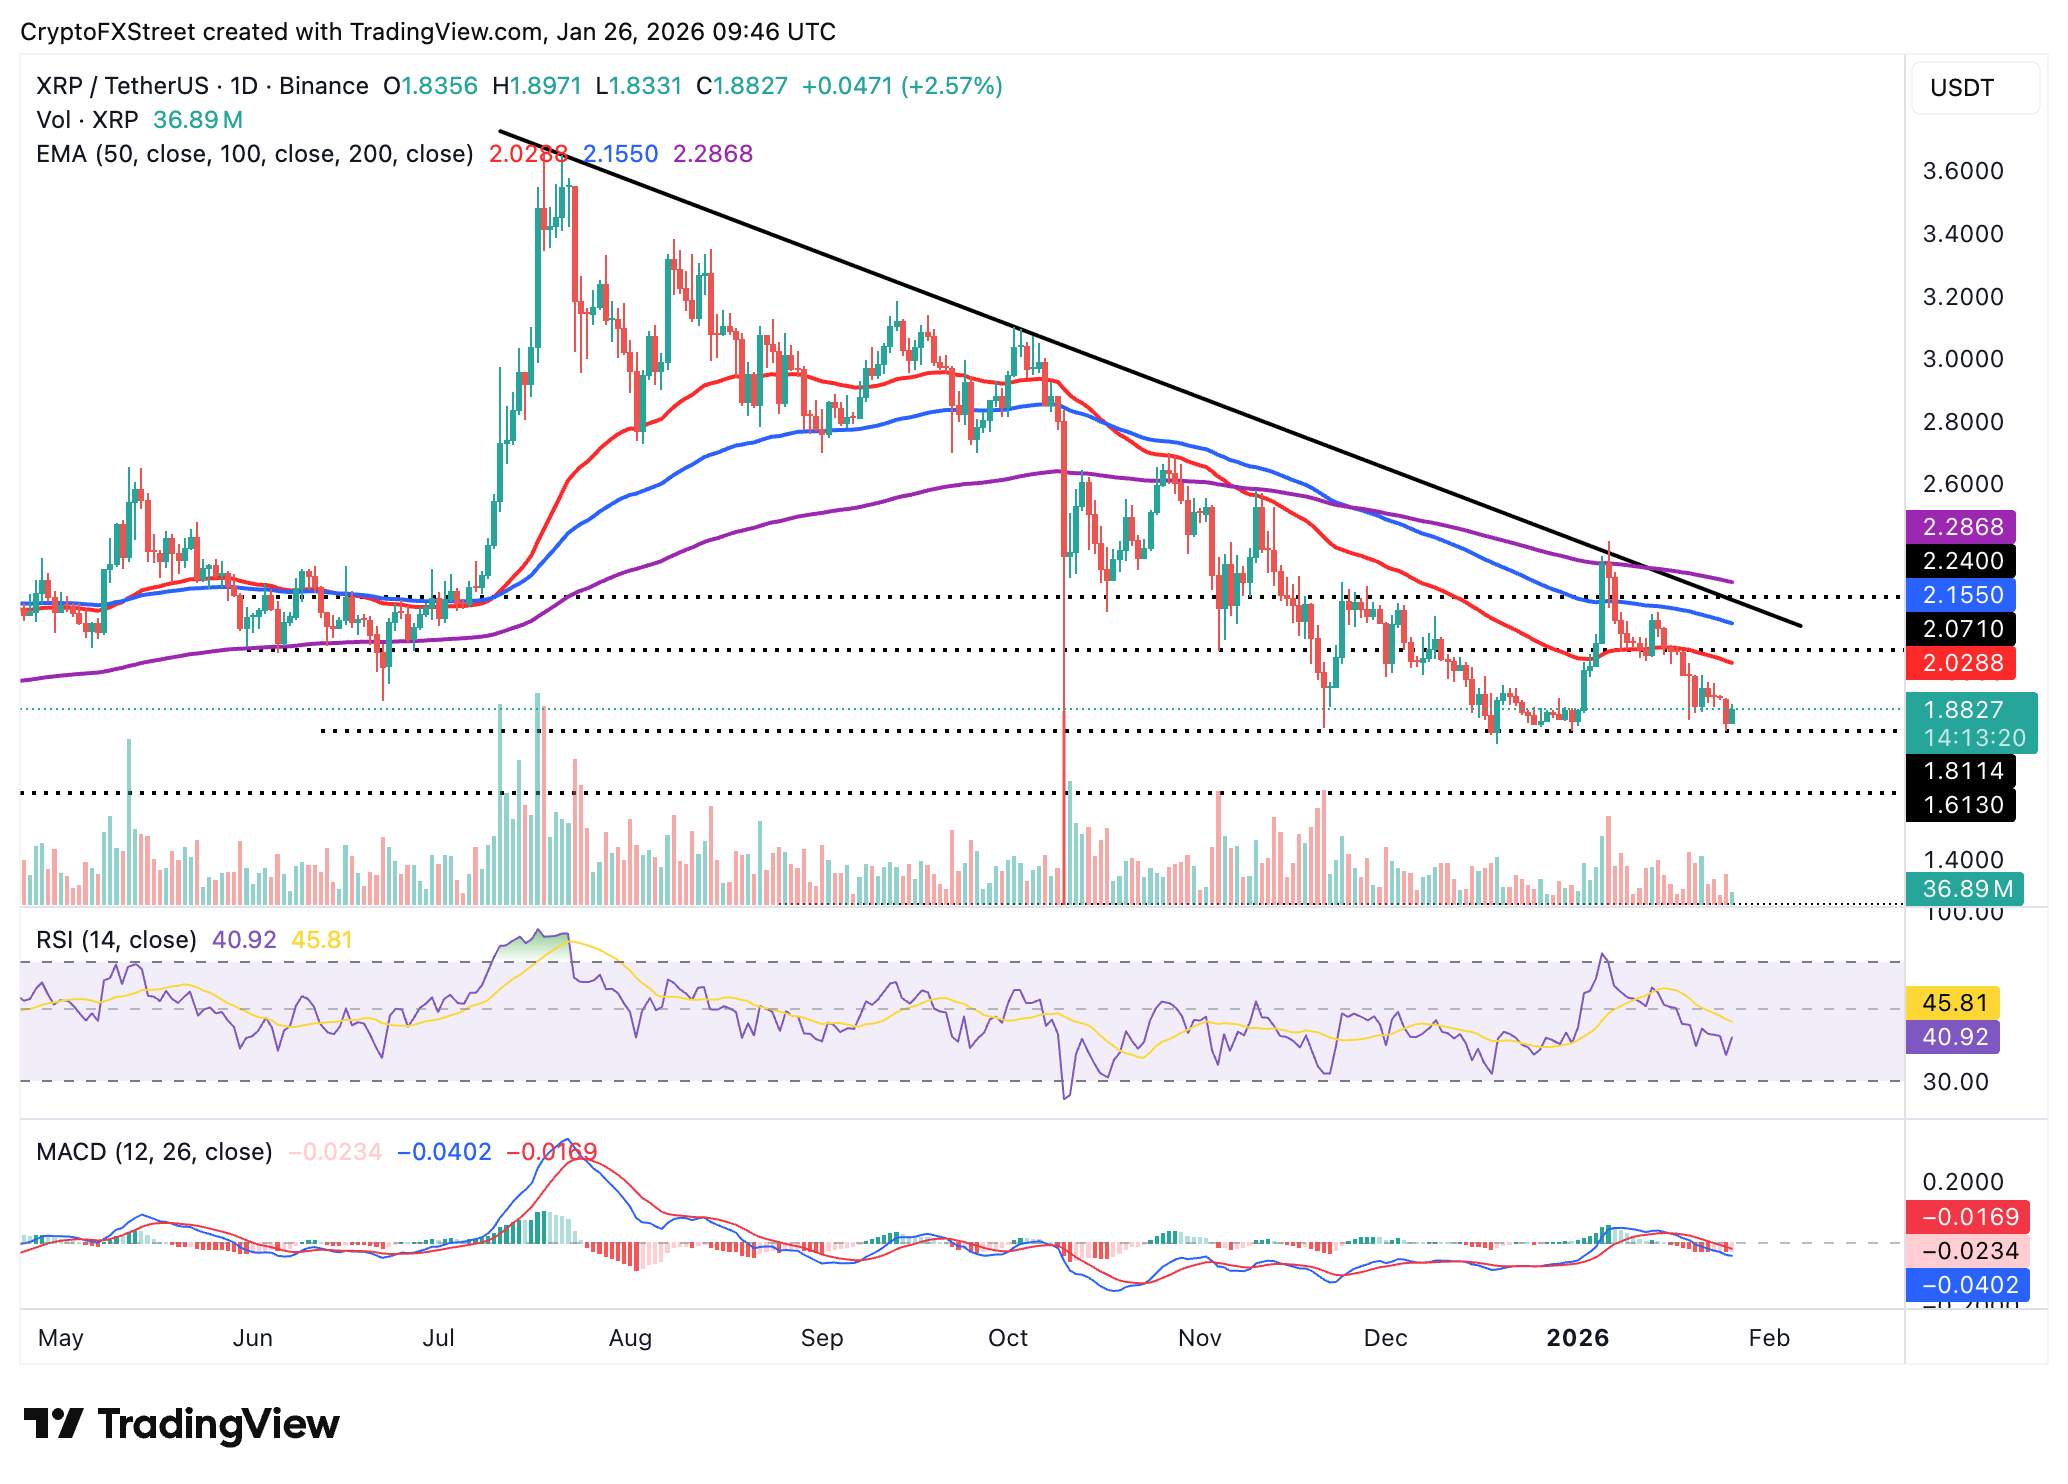
Meanwhile, XRP remains below the 50-day EMA at $2.03, the 100-day EMA at $2.16 and the 200-day EMA at $2.29. Besides the moving average cluster capping the upside, it is also sloping downward, emphasising the overall bearish outlook. The MACD indicator on the same chart remains below the signal line, increasing the odds of robust bearish momentum. A correction below Sunday’s low at $1.81 may extend the sell-off down to April’s support at $1.61.
Cryptocurrency metrics FAQs
The developer or creator of each cryptocurrency decides on the total number of tokens that can be minted or issued. Only a certain number of these assets can be minted by mining, staking or other mechanisms. This is defined by the algorithm of the underlying blockchain technology. On the other hand, circulating supply can also be decreased via actions such as burning tokens, or mistakenly sending assets to addresses of other incompatible blockchains.
Market capitalization is the result of multiplying the circulating supply of a certain asset by the asset’s current market value.
Trading volume refers to the total number of tokens for a specific asset that has been transacted or exchanged between buyers and sellers within set trading hours, for example, 24 hours. It is used to gauge market sentiment, this metric combines all volumes on centralized exchanges and decentralized exchanges. Increasing trading volume often denotes the demand for a certain asset as more people are buying and selling the cryptocurrency.
Funding rates are a concept designed to encourage traders to take positions and ensure perpetual contract prices match spot markets. It defines a mechanism by exchanges to ensure that future prices and index prices periodic payments regularly converge. When the funding rate is positive, the price of the perpetual contract is higher than the mark price. This means traders who are bullish and have opened long positions pay traders who are in short positions. On the other hand, a negative funding rate means perpetual prices are below the mark price, and hence traders with short positions pay traders who have opened long positions.
บทความแนะนำ


