


Pi Network Price Forecast: PI holds rebound amid improving market sentiment
- Pi Network holds above $0.2000 on Wednesday after bouncing over 1% from a local support trendline the previous day.
- A recovery in broader market sentiment signals renewed risk appetite among investors.
- Technically, Pi Network remains vulnerable to supply pressure due to a lack of conviction in momentum indicators.
Pi Network (PI) trades around $0.2100 at press time on Wednesday, steadying after a 1% bounce back from a crucial support trendline on the previous day. The rebound aligns with improving sentiment across the broader cryptocurrency market as Bitcoin (BTC) resurfaces above $95,000. Still, the technical outlook for PI remains mixed as recovery approaches a key resistance but lacks strength.
Pi Network flashes mixed potential amid elevating market sentiment
Pi Network jumped 1.55% on Tuesday, recovering from the 1% decline at the start of this week. This recovery aligned with the broader market recovery, driven by a softer-than-expected US core Consumer Price Index (CPI) and a draft bill on a new crypto market structure by the US Senate.
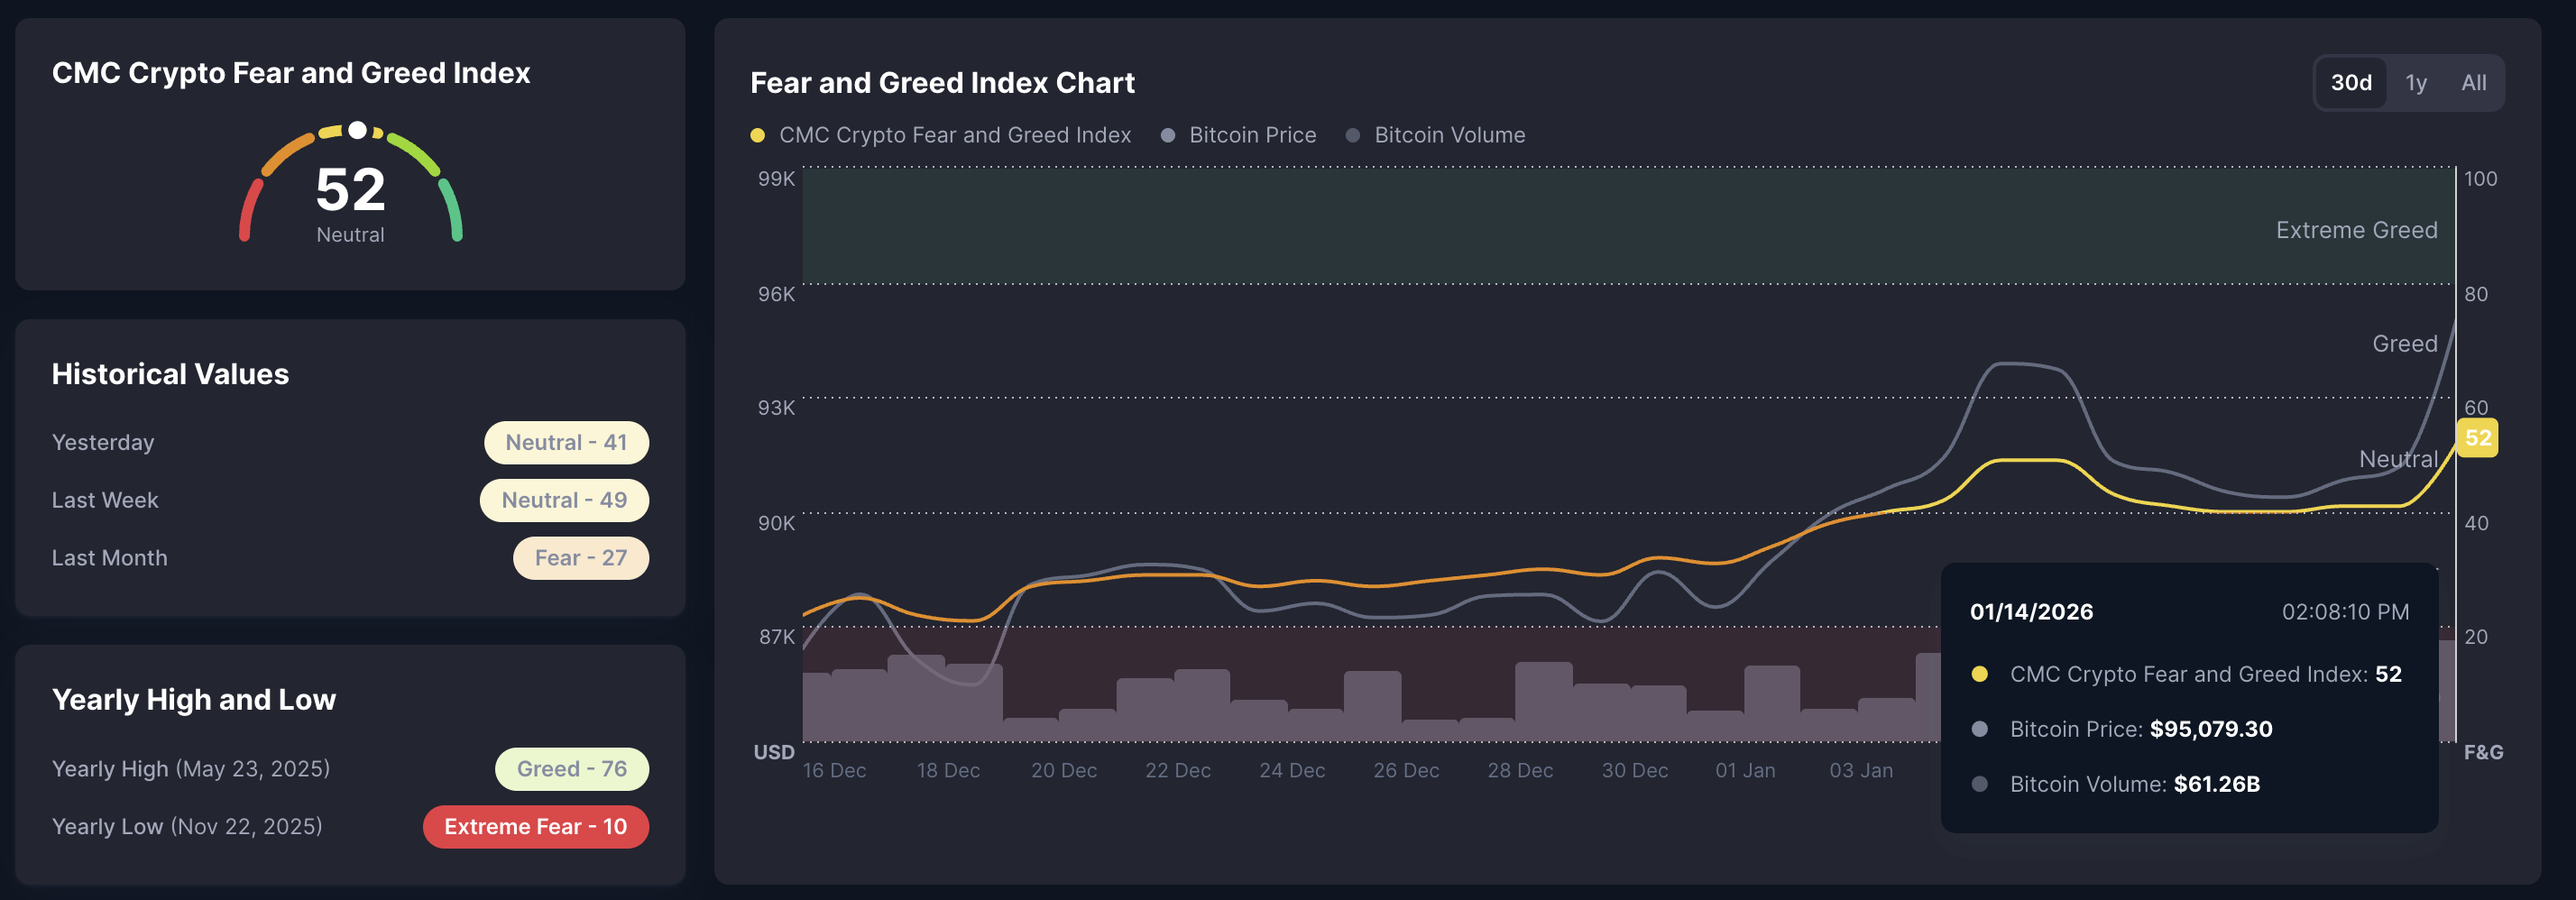
This lift in bullish sentiment across the crypto market is evident in the Fear and Greed Index, which is at 52, up from 31 on January 1, suggesting a shift from fear-dominant to neutral sentiment. Typically, values above 60 indicate greed, between 40 and 60 reflect neutral sentiment, and below 40 point to fear.
Unlike the muted price movement since the announcement of Pi Library on January 9, which offered Pi Payments integrations in Pi applications, a sentiment-driven recovery could provide a short-term, sustained recovery.
Pi shows a lack of conviction in momentum indicators
At the time of writing, PI stabilizes near $0.2100 after a rebound from a local support trendline connecting the December 17 and 30 lows.
The Relative Strength Index (RSI) is at 50 on the daily logarithmic chart, flattening near the midline, suggesting a lack of a clear momentum. At the same time, the Moving Average Convergence Divergence (MACD) indicator hovers above the signal line, avoiding a bearish crossover, but the declining histogram bars suggest weakness in bullish momentum.
If PI clears the overhead resistance levels, including the 50-day Exponential Moving Average (EMA) at $0.2149 and the December 19 high at $0.2177, it could extend the rally to the September 23 low at $0.2613.
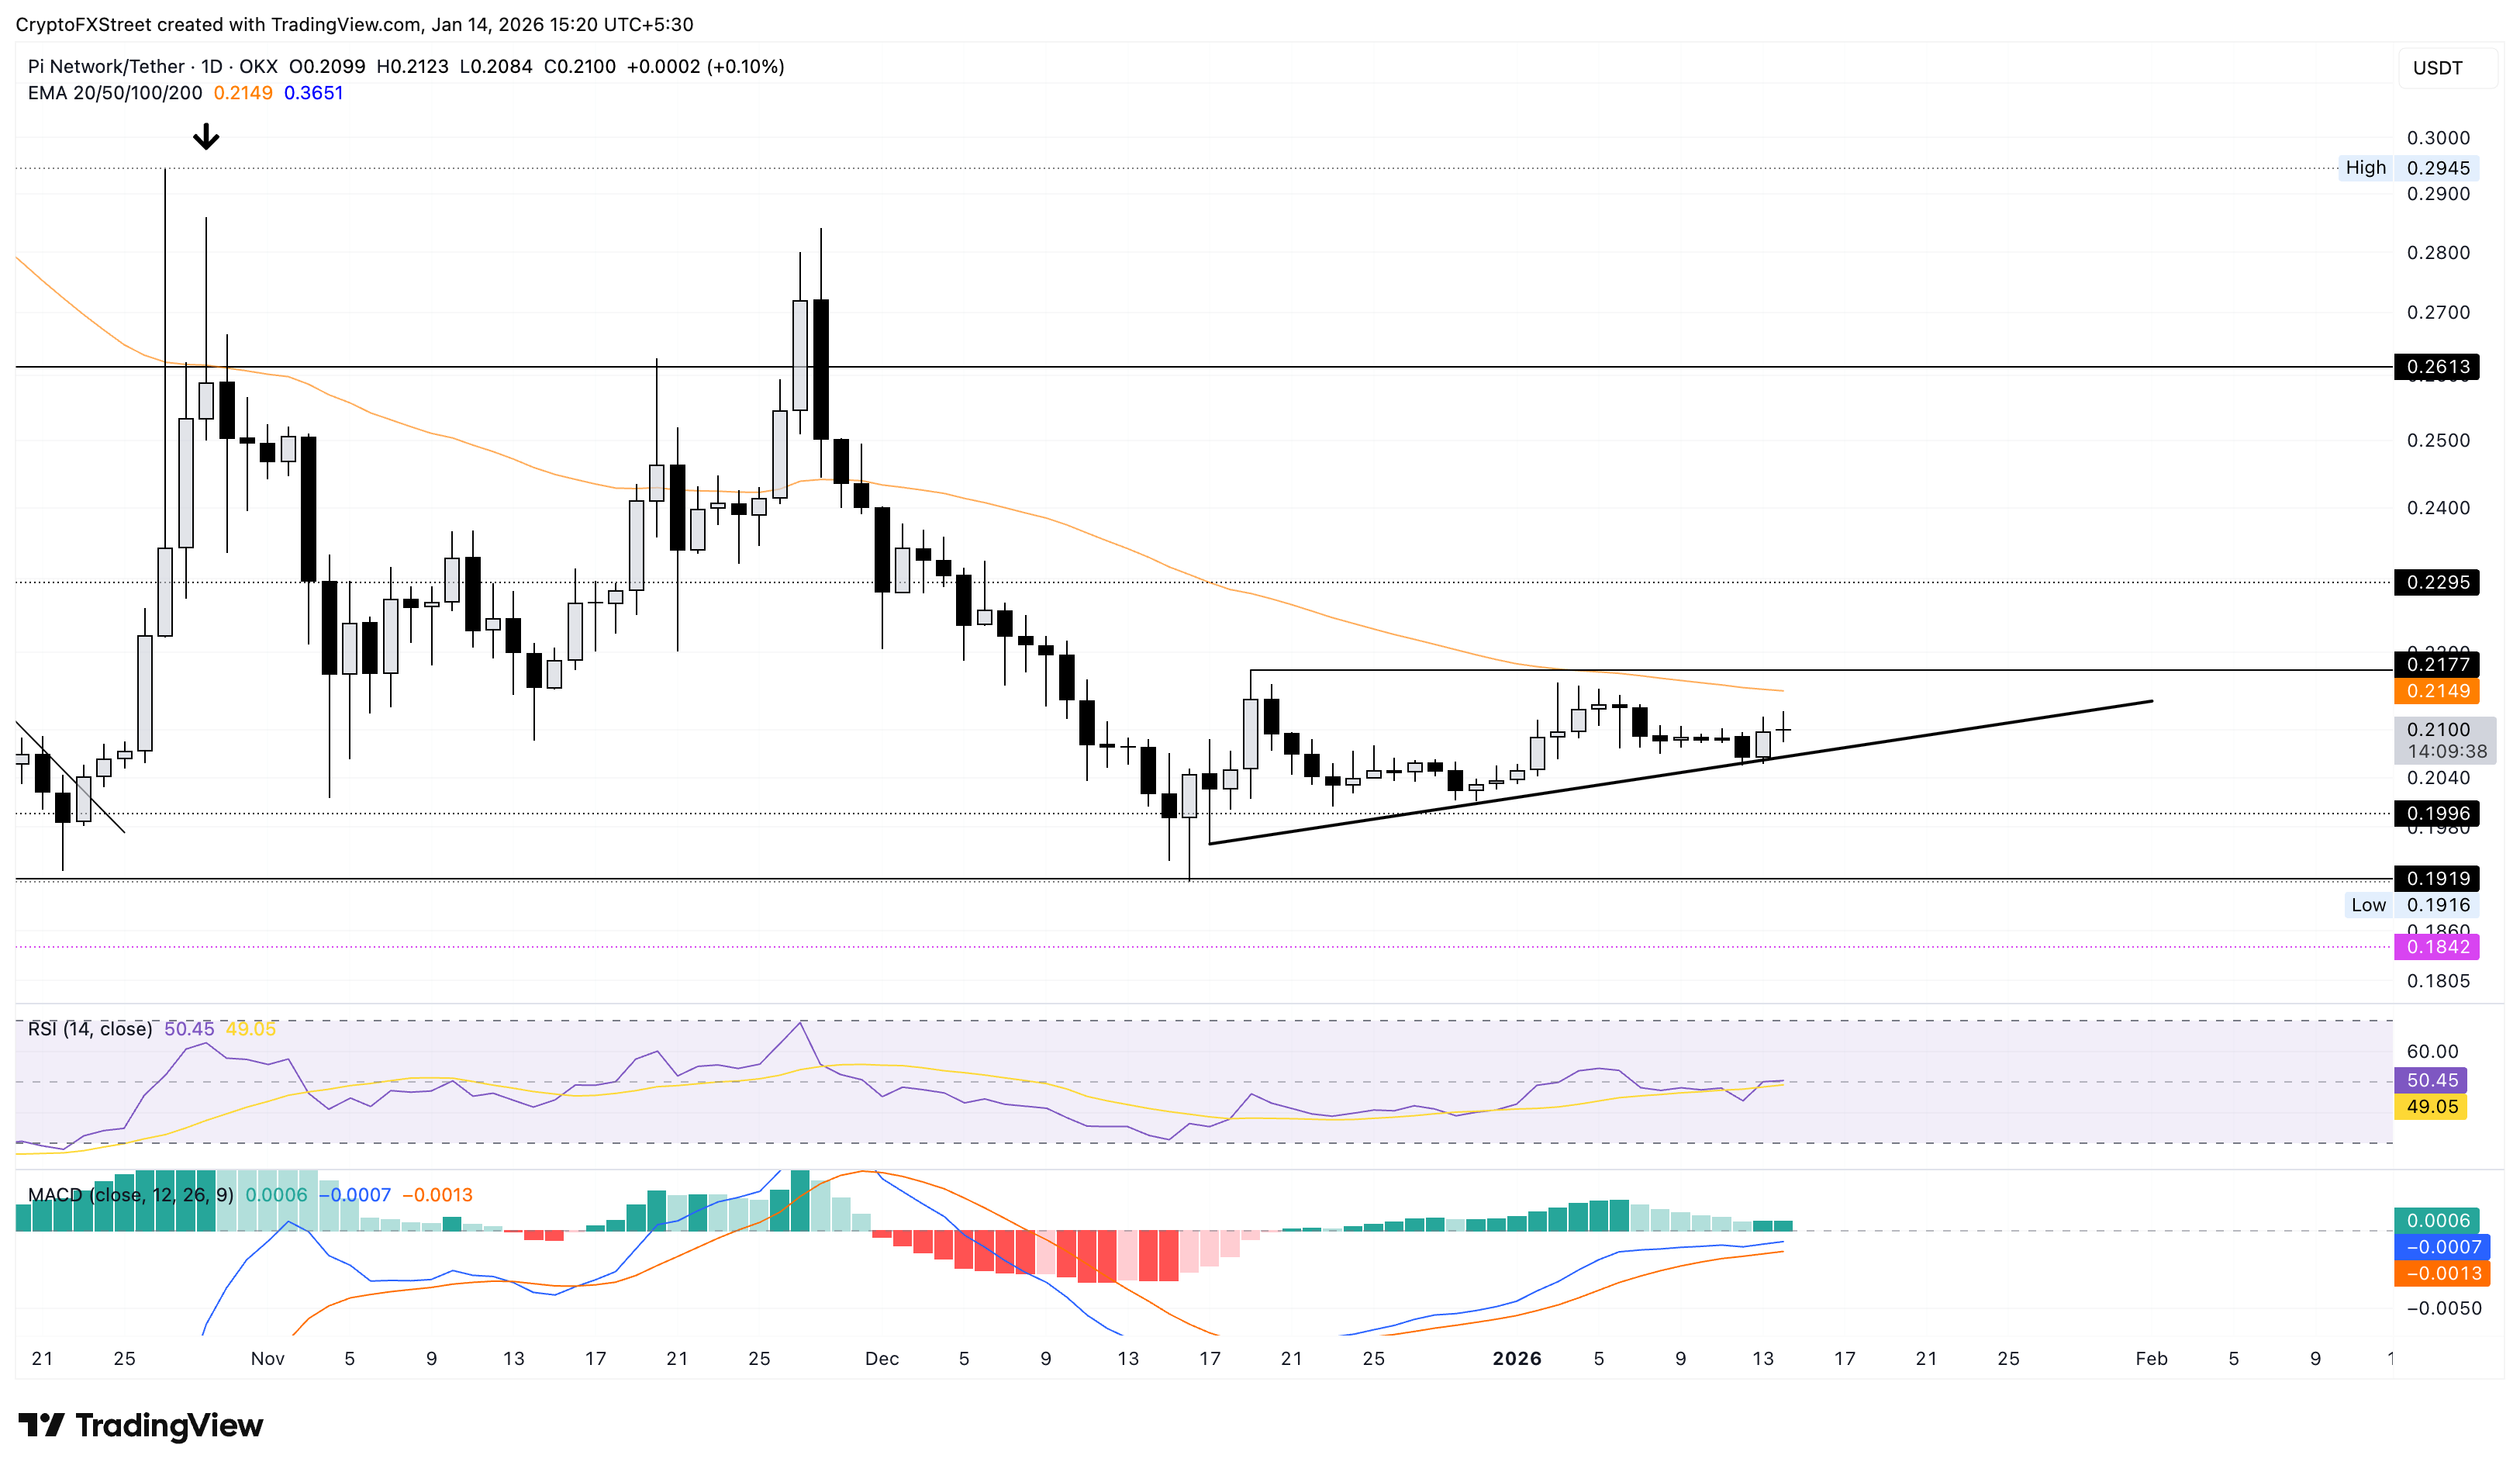
On the flip side, a reversal below $0.2000 could test the October 11 low at $0.1919.
Bitcoin, altcoins, stablecoins FAQs
Bitcoin is the largest cryptocurrency by market capitalization, a virtual currency designed to serve as money. This form of payment cannot be controlled by any one person, group, or entity, which eliminates the need for third-party participation during financial transactions.
Altcoins are any cryptocurrency apart from Bitcoin, but some also regard Ethereum as a non-altcoin because it is from these two cryptocurrencies that forking happens. If this is true, then Litecoin is the first altcoin, forked from the Bitcoin protocol and, therefore, an “improved” version of it.
Stablecoins are cryptocurrencies designed to have a stable price, with their value backed by a reserve of the asset it represents. To achieve this, the value of any one stablecoin is pegged to a commodity or financial instrument, such as the US Dollar (USD), with its supply regulated by an algorithm or demand. The main goal of stablecoins is to provide an on/off-ramp for investors willing to trade and invest in cryptocurrencies. Stablecoins also allow investors to store value since cryptocurrencies, in general, are subject to volatility.
Bitcoin dominance is the ratio of Bitcoin's market capitalization to the total market capitalization of all cryptocurrencies combined. It provides a clear picture of Bitcoin’s interest among investors. A high BTC dominance typically happens before and during a bull run, in which investors resort to investing in relatively stable and high market capitalization cryptocurrency like Bitcoin. A drop in BTC dominance usually means that investors are moving their capital and/or profits to altcoins in a quest for higher returns, which usually triggers an explosion of altcoin rallies.
บทความแนะนำ


