
Ripple Price Forecast: XRP hammers on $2.00 support as downside risks escalate
- XRP edges lower as investors reduce exposure after the Fed’s rate cut.
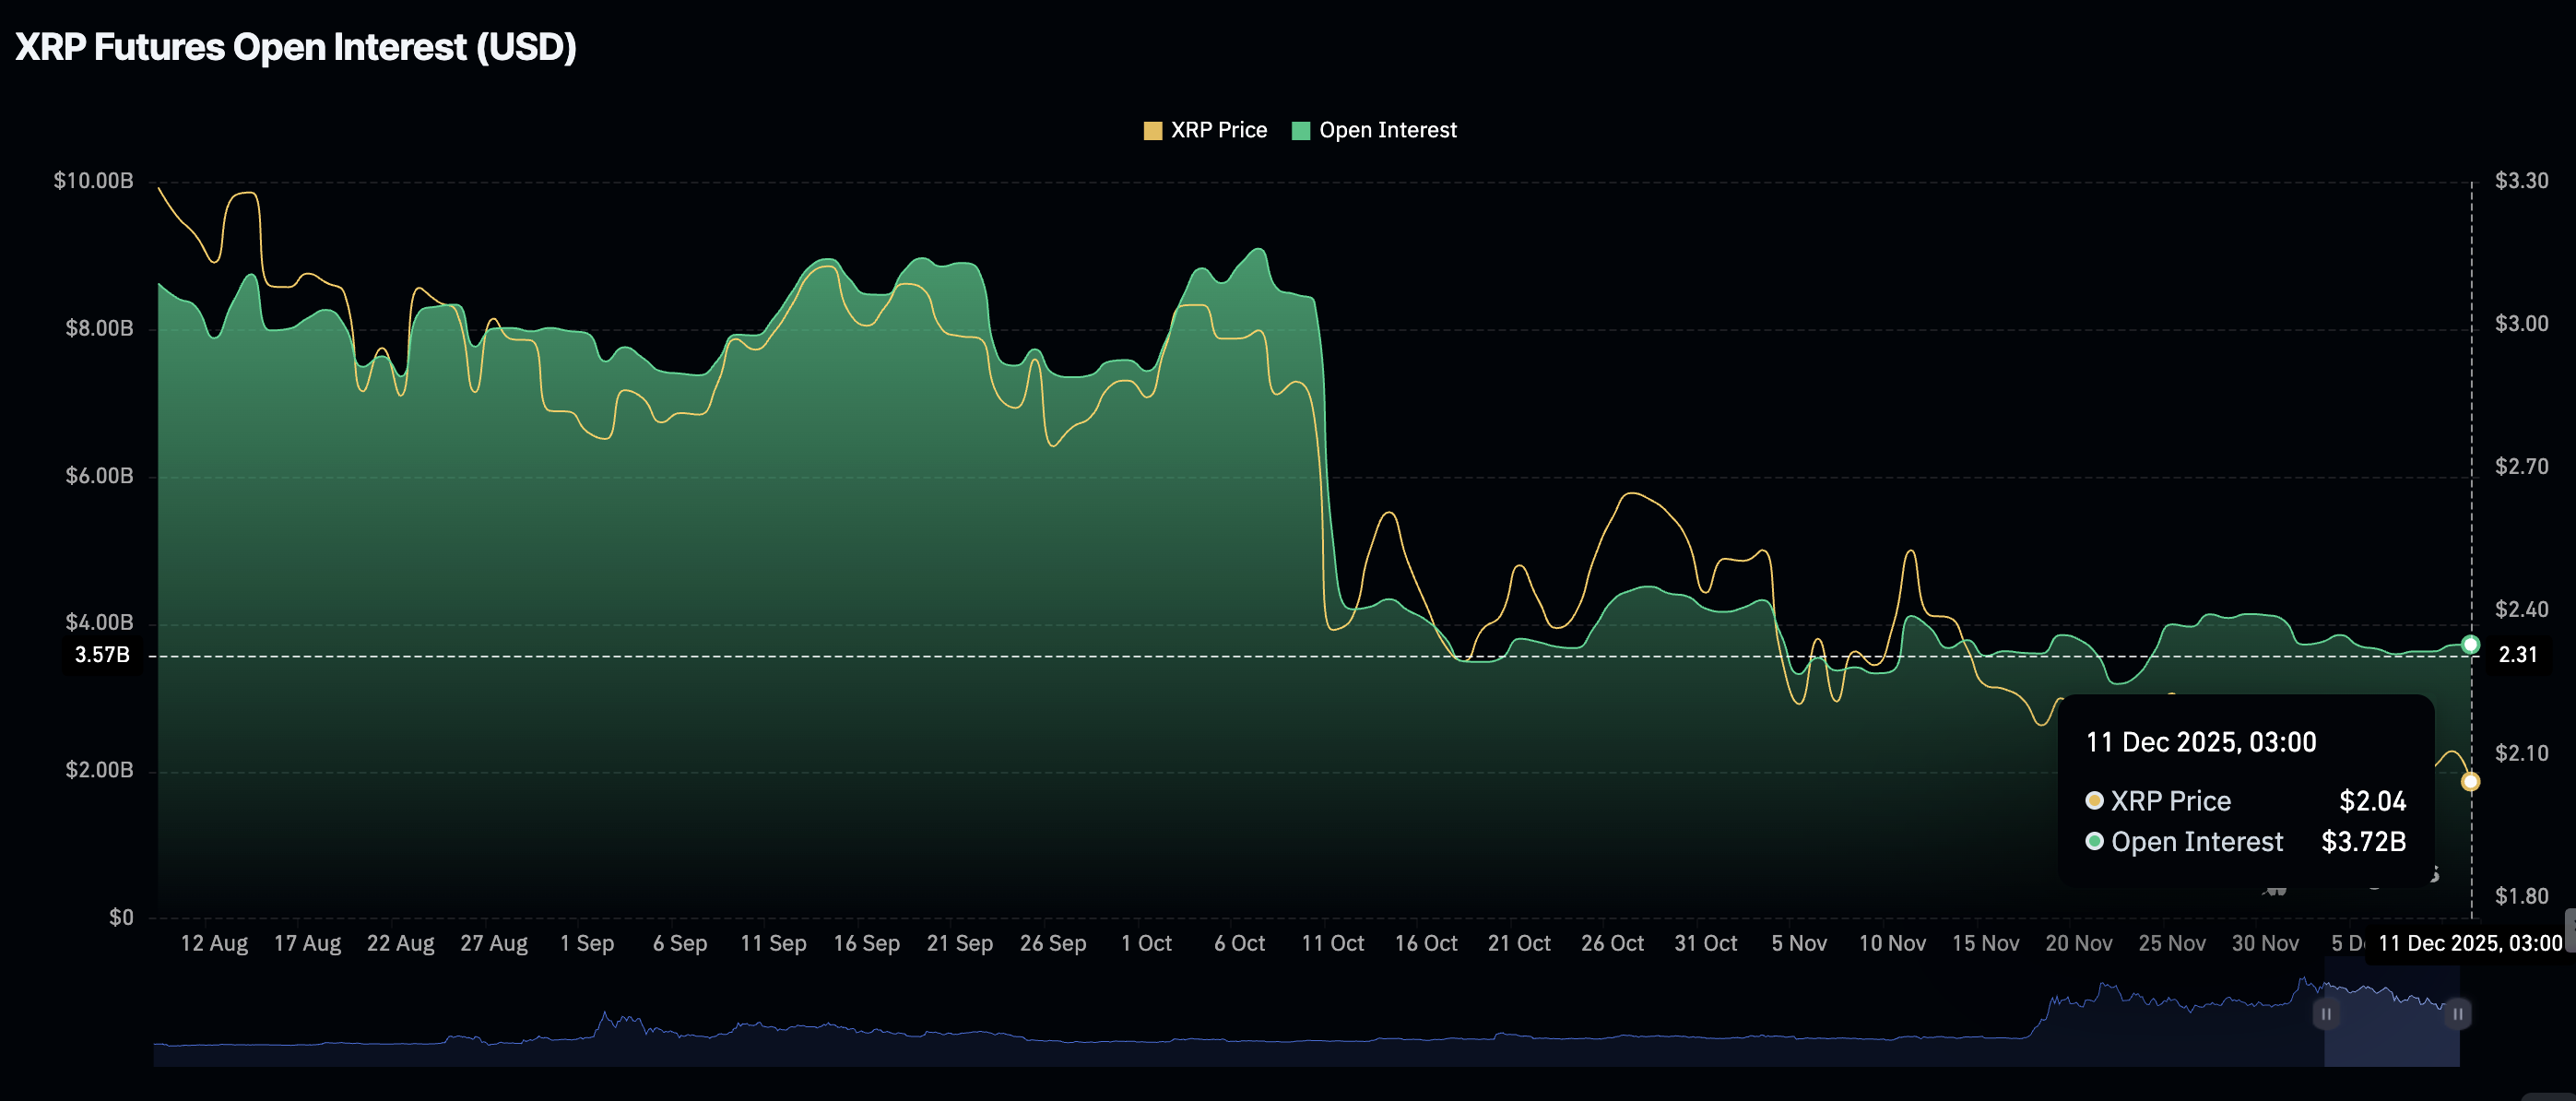
- XRP faces subdued retail demand, with Open Interest averaging $3.72 billion, compared to the $10.94 billion record high.
- XRP ETFs extend mild inflows despite persistent risk-off sentiment in the broader crypto market.
Ripple (XRP) is trading above $2.00 at the time of writing on Thursday, weighed down by increasing selling pressure in the broader cryptocurrency market. Short-term technical signals underpin the bearish outlook, which could accelerate the downtrend toward April’s low of $1.61.
Meanwhile, the Federal Reserve (Fed) proceeded with the much-anticipated cut, bringing its benchmark lending rate to a range of 3.50%-3.75% on Wednesday. Despite meeting expectations, the rate cut was accompanied by a cautious tone.
Fed Chair Jerome Powell emphasized upside inflation risks and a slow labor market as factors that could support fewer rate cuts in the coming year, dampening sentiment across the cryptocurrency market.
Retail demand wanes as XRP struggles
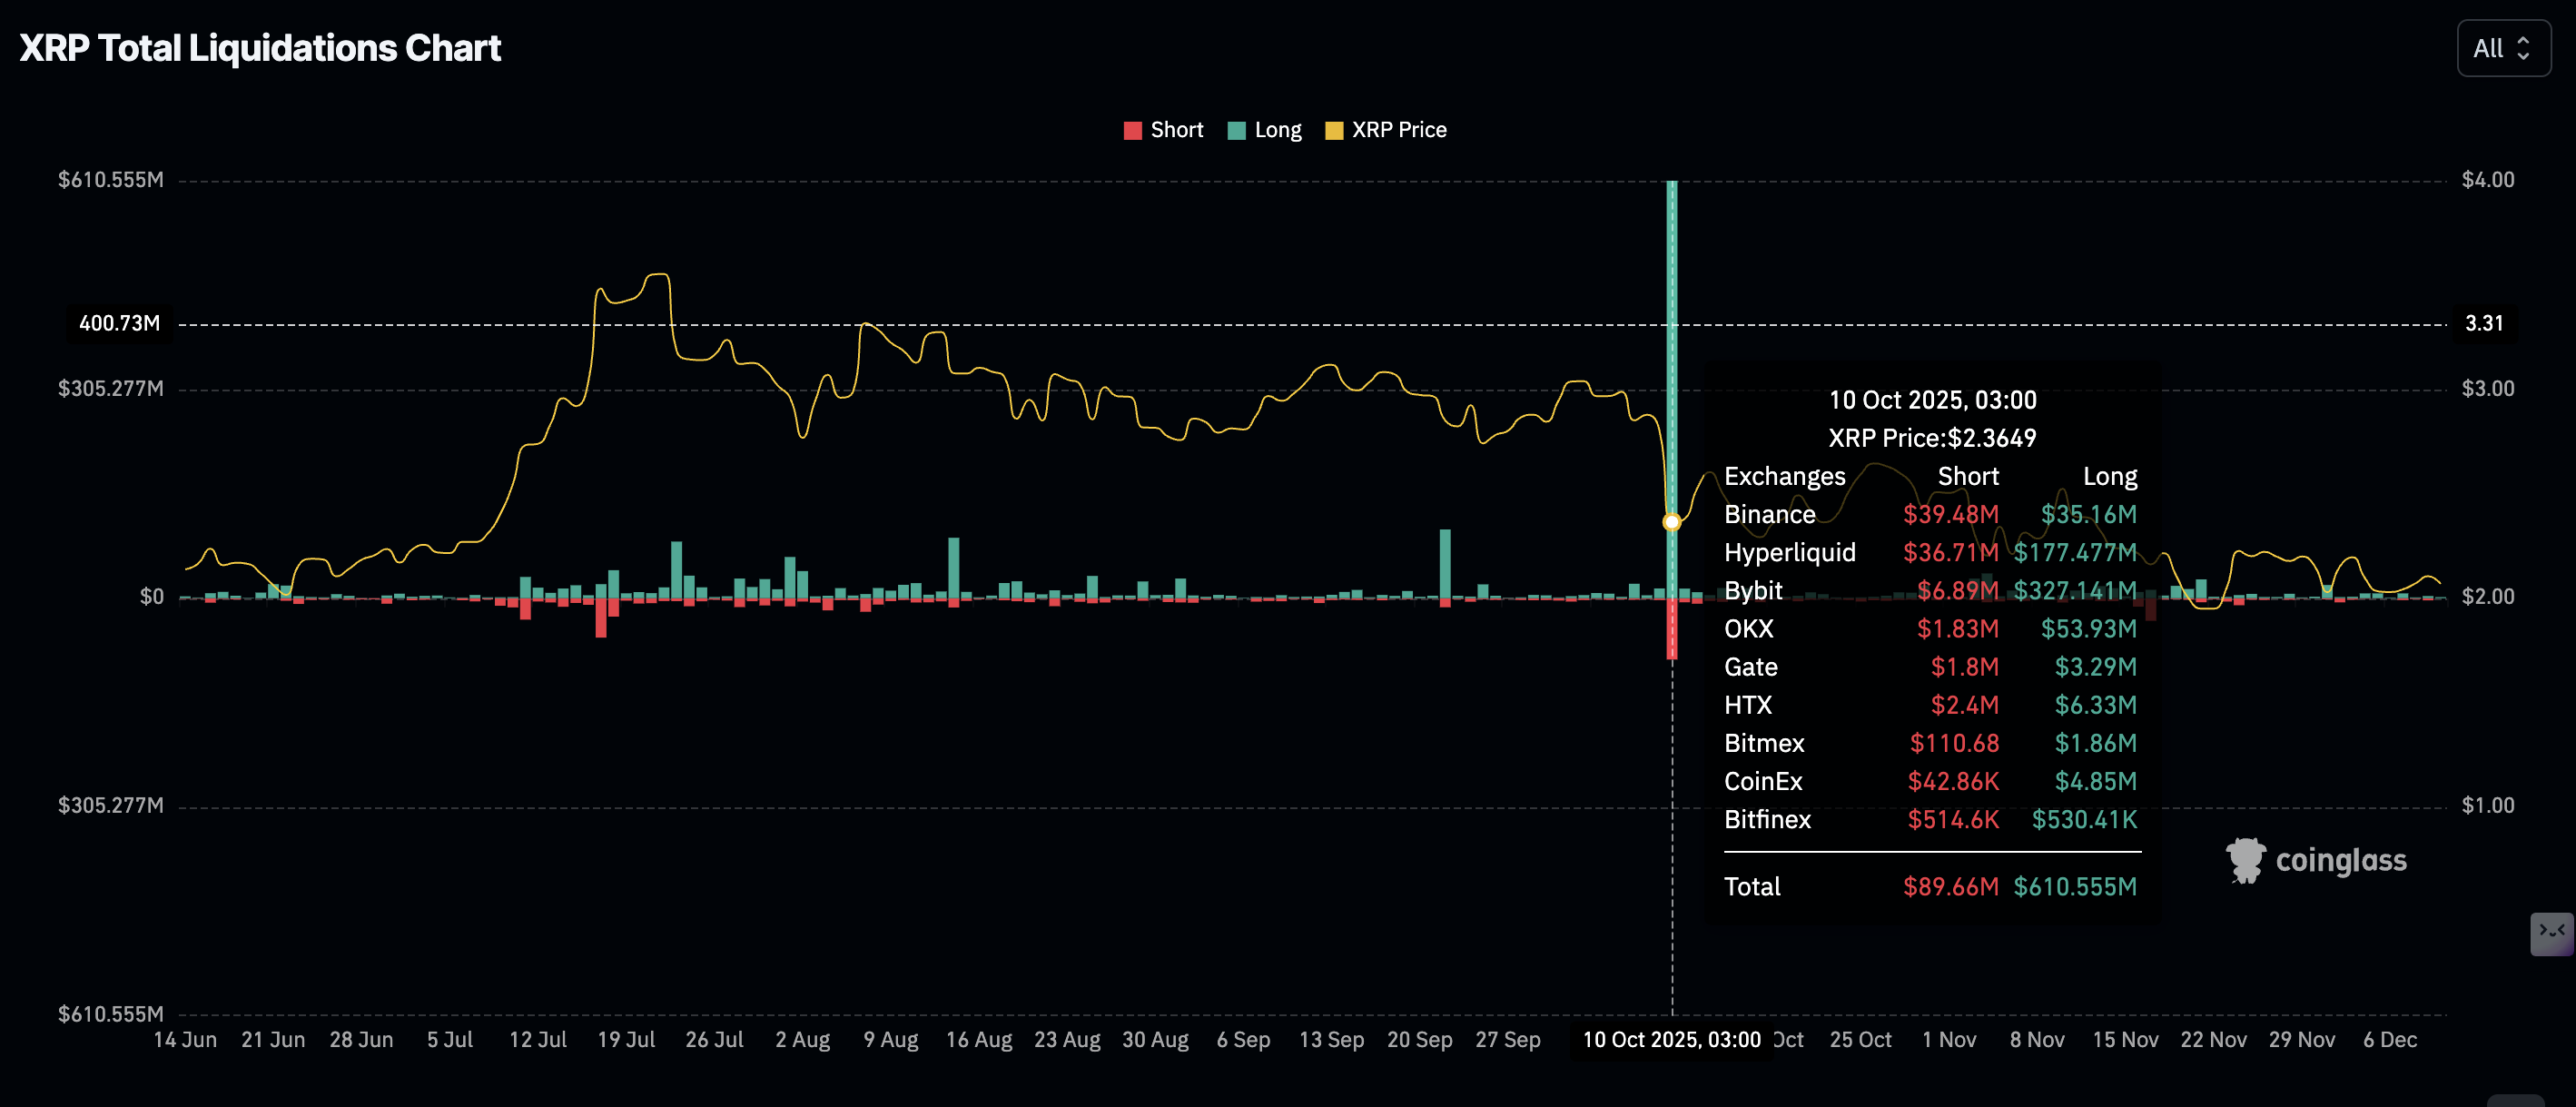
A weak derivatives market has persisted since the October 10 flash crash, which liquidated almost $611 million in XRP-related long positions and approximately $90 million in shorts.
Meanwhile, demand for XRP derivatives has stabilized, albeit at significantly lower levels, with futures Open Interest (OI) standing at $3.71 billion on Thursday, down from $8.36 billion on October 10 and from the $10.94 billion reached in July.
OI represents the notional value of outstanding futures contracts. Low OI suggests investors are not convinced XRP can sustain an uptrend in the near term.
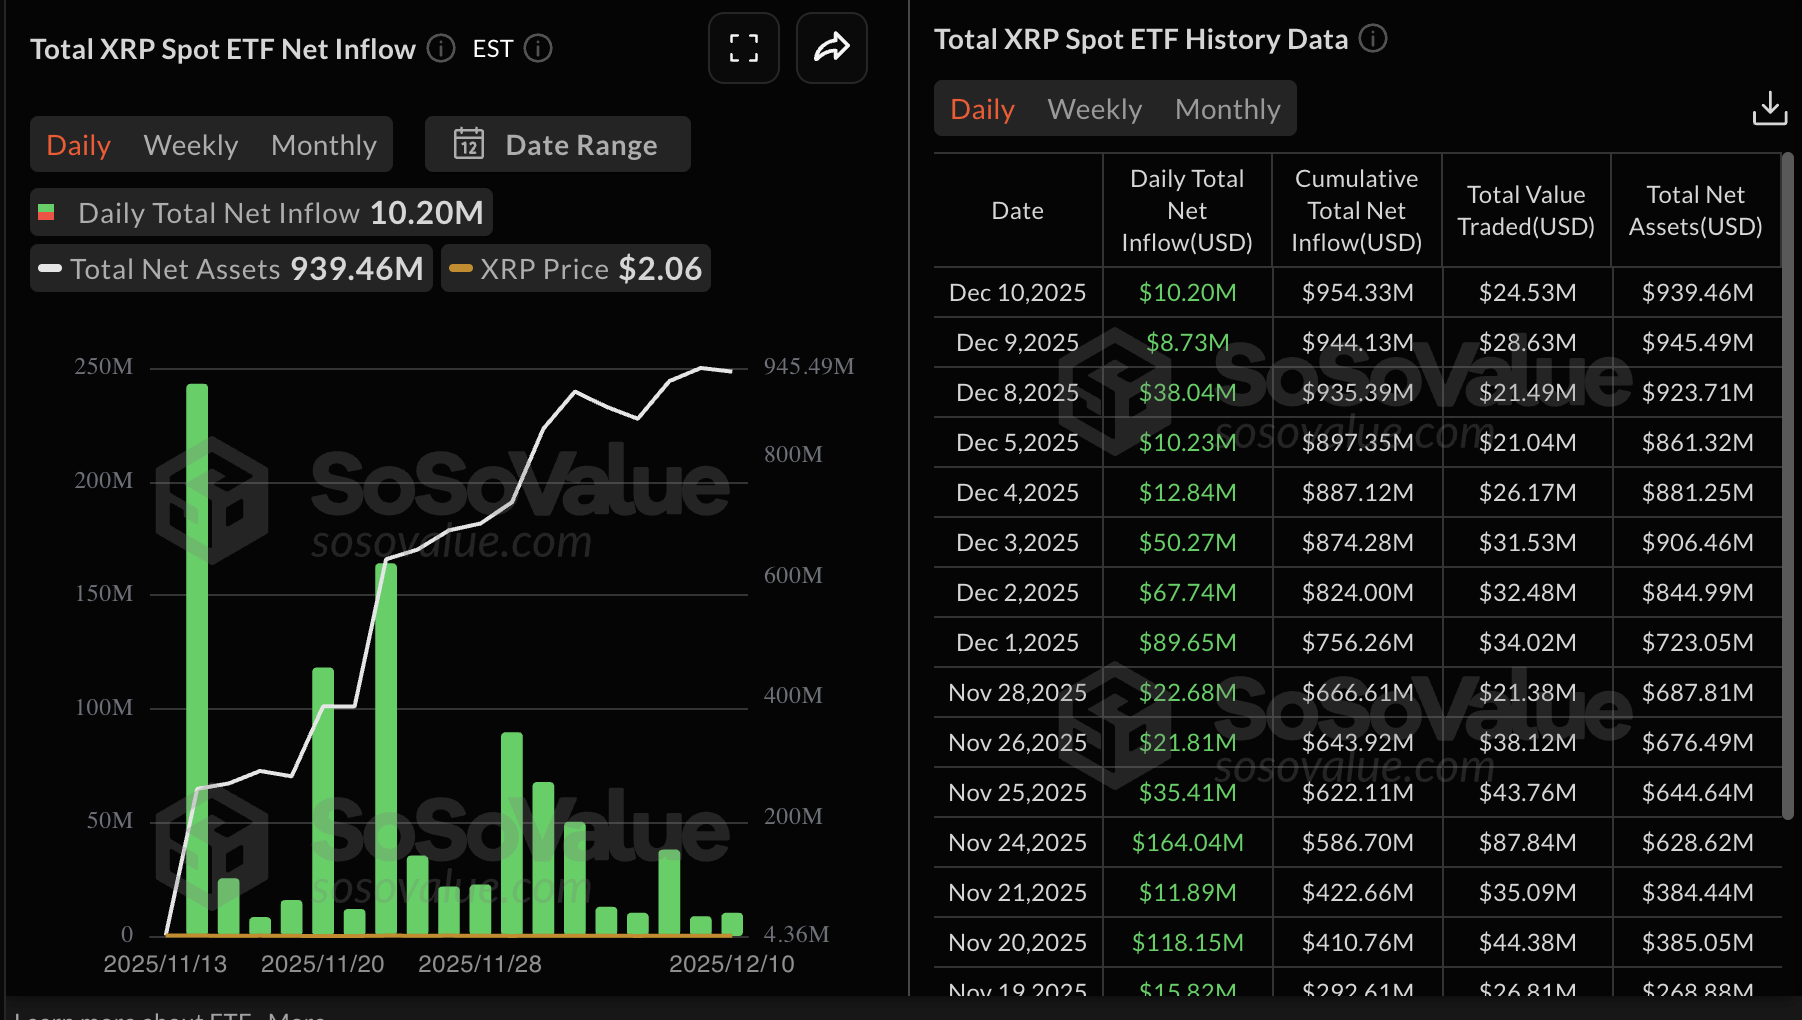
Despite macroeconomic uncertainty and a weak derivatives market, XRP spot Exchange Traded Funds (ETFs) posted inflows of $10 million on Wednesday – a slight improvement from $9 million the previous day.
Since their launch on November 13, XRP ETFs have not experienced outflows, with cumulative inflows totaling $954 million and net assets amounting to $940 million.
Technical Outlook: Assessing XRP’s downside risks
XRP hovers above its short-term support at $2.00 at the time of writing on Thursday, but also sits below the 50-day Exponential Moving Average (EMA), the 100-day EMA, and the 200-day EMA, which slope lower and maintain an overall bearish alignment. The Moving Average Convergence Divergence (MACD) hovers below the zero line, with the blue MACD line marginally above the red signal line and barely positive and contracting green histogram bars. The Relative Strength Index (RSI) at 40 leans bearish, suggesting rallies could stay limited.
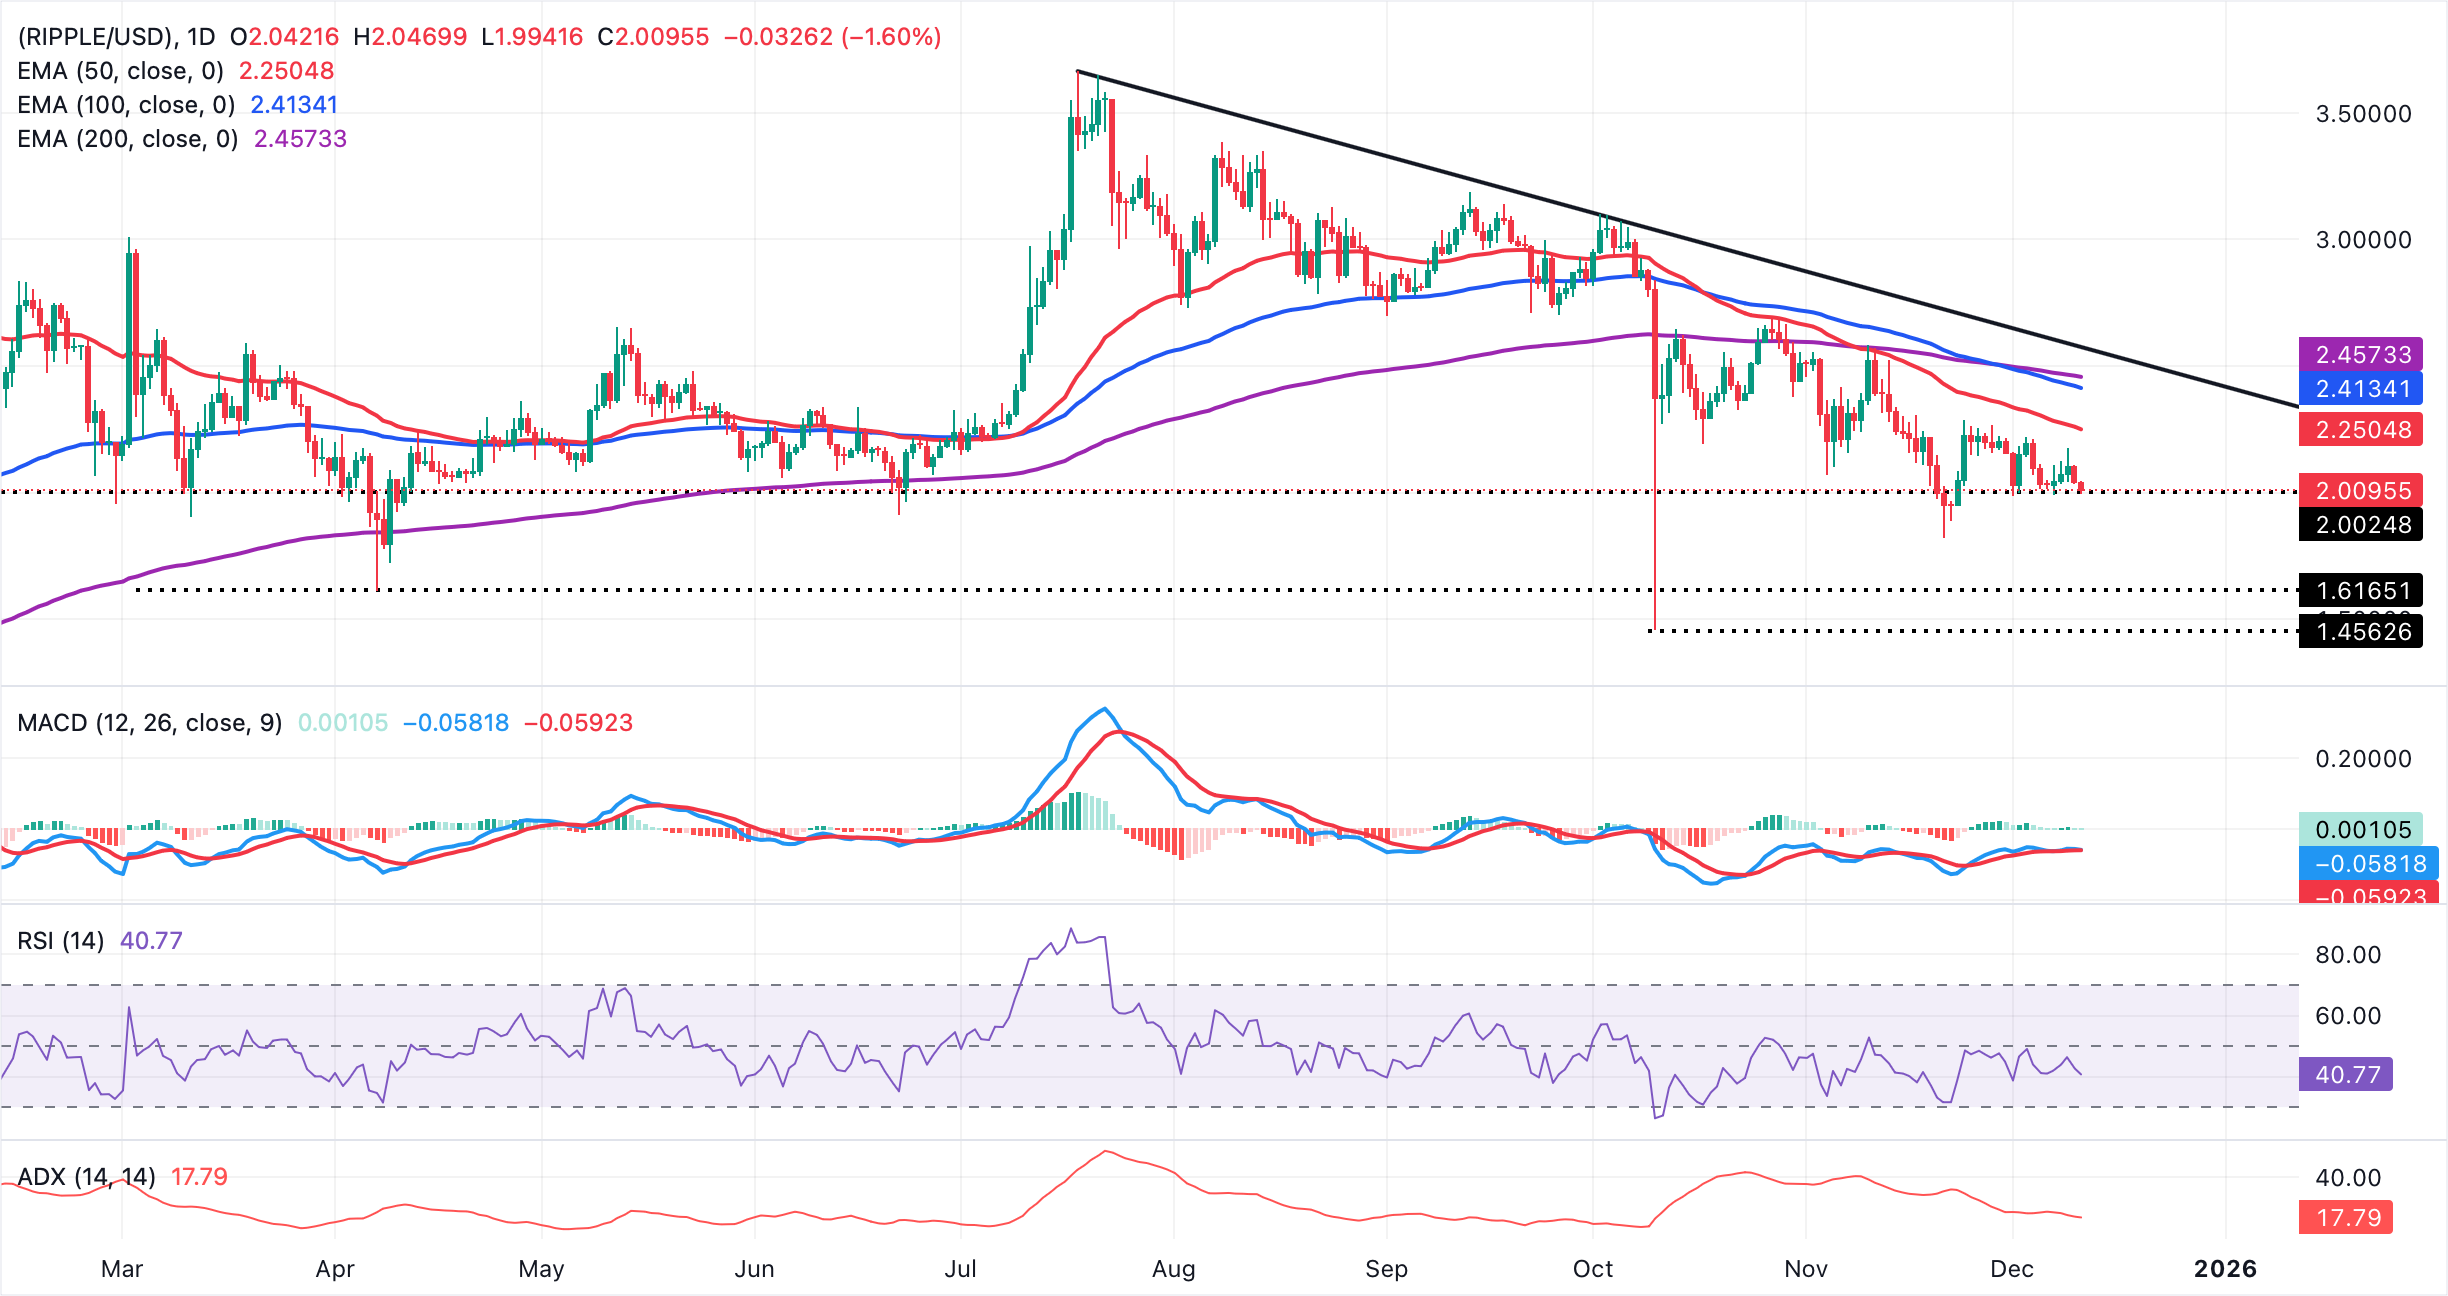
The descending trend line from the record of $3.66 caps the upside, with resistance seen at $2.57. Initial resistance stands at the 50-day EMA at $2.25, followed by the 100-day EMA at $2.41 and the 200-day EMA at $2.45. The Average Directional Index (ADX) at 17 reflects weak trend strength.
Still, a daily close above the hurdle $2.25 could ease pressure and open the path toward $2.41 and $2.45, while failure to reclaim the first barrier would keep sellers in control beneath the trend-line cap.
Open Interest, funding rate FAQs
Higher Open Interest is associated with higher liquidity and new capital inflow to the market. This is considered the equivalent of increase in efficiency and the ongoing trend continues. When Open Interest decreases, it is considered a sign of liquidation in the market, investors are leaving and the overall demand for an asset is on a decline, fueling a bearish sentiment among investors.
Funding fees bridge the difference between spot prices and prices of futures contracts of an asset by increasing liquidation risks faced by traders. A consistently high and positive funding rate implies there is a bullish sentiment among market participants and there is an expectation of a price hike. A consistently negative funding rate for an asset implies a bearish sentiment, indicating that traders expect the cryptocurrency’s price to fall and a bearish trend reversal is likely to occur.
(The technical analysis of this story was written with the help of an AI tool)
บทความแนะนำ


