


Cardano Price Forecast: ADA steadies as holders drive bullish momentum
- Cardano price steadies around $0.43 on Tuesday, after rallying 3.71% in the previous week.
- On-chain and derivatives back a rally as holders accumulate ADA tokens.
- The technical outlook suggests further upside, with ADA eyeing a move toward $0.49.
Cardano (ADA) price steadies around $0.43 at the time of writing on Tuesday after rallying nearly 4% the previous day. Growing accumulation among holders and strengthening derivatives signals bullish sentiment, positioning ADA for a potential move toward the next key resistance zone.
Large holders accumulate, Funding Rate turns positive, boosting bullish sentiment
Santiment’s Supply Distribution data supports a bullish outlook for Cardano, as certain whale wallets are accumulating ADA tokens.
The metric indicates that whales holding between 10 million and 100 million ADA tokens (blue line) have accumulated 160 million tokens since December 2. During the same period, wallets holding between 1 million and 10 million ADA tokens (yellow line) have shed 90 million tokens.
This shows that the second cohort of whales could have fallen prey to the capitulation event. In contrast, the first set of wallets seized the opportunity and accumulated Cardano at a discount.
 [07-1765247626280-1765247626281.33.16, 09 Dec, 2025].png)
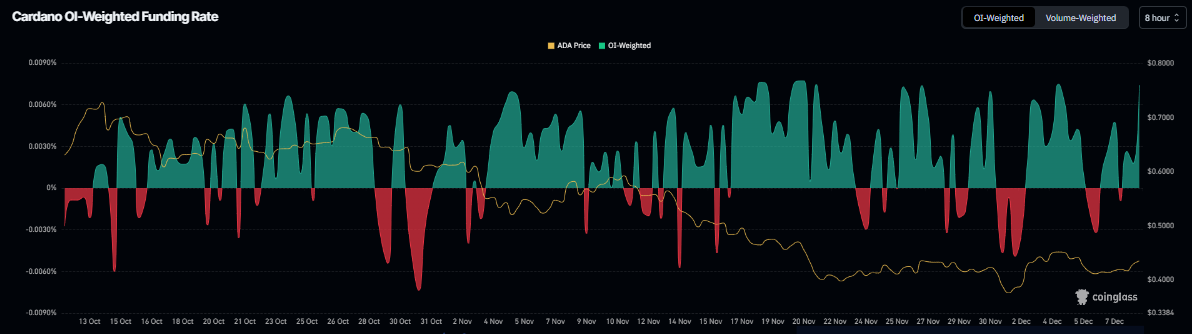
Apart from the holders accumulating, Coinglass’s OI-Weighted Funding Rate data shows that the number of traders betting that the price of ADA will slide further is lower than that anticipating a price increase.
The metric flipped to a positive rate on Monday and reads 0.0074% on Tuesday, indicating that longs are paying shorts. Historically, as shown in the chart below, when the funding rates have flipped from negative to positive, the Cardano price has rallied sharply.
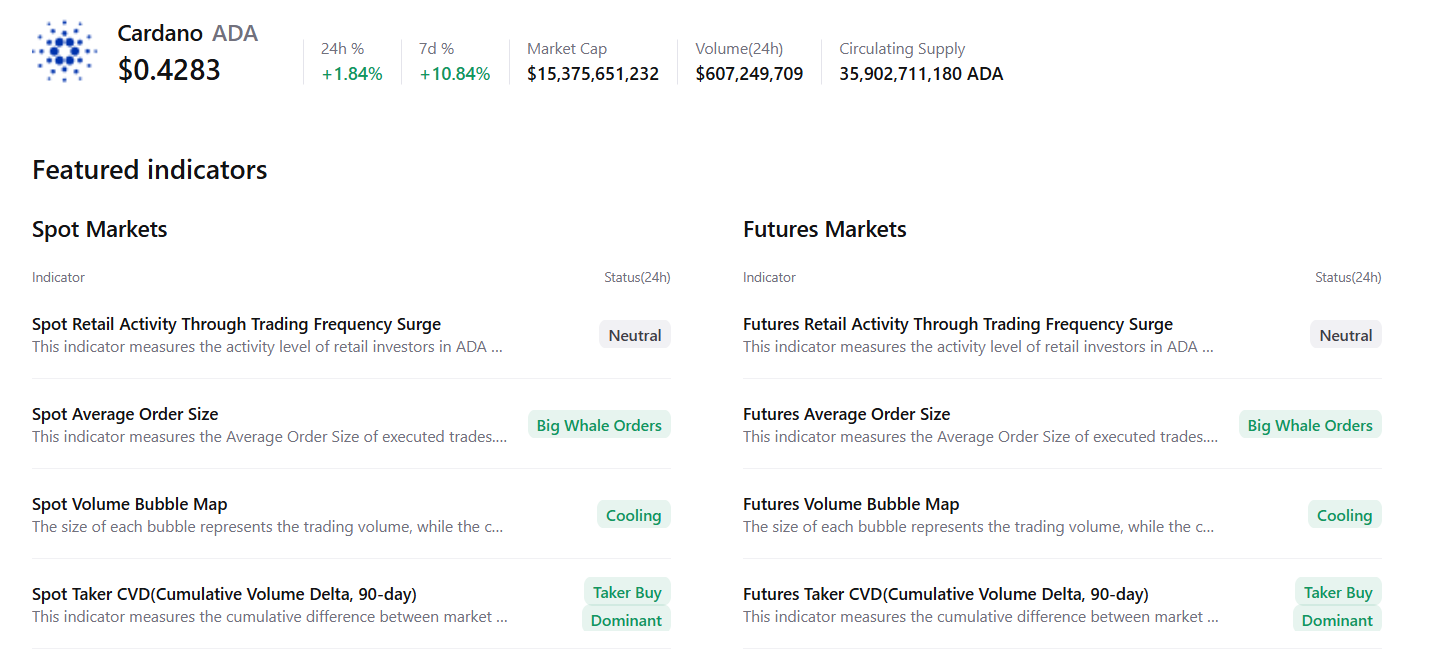
CryptoQuant’s summary data also supports the bullish outlook, as Cardano’s spot and futures markets show large whale orders, cooling conditions, and buy dominance. These factors signal a potential rally in the upcoming days.
Cardano Price Forecast: ADA breaks above the falling wedge pattern
Cardano price broke above the falling wedge pattern (drawn by connecting multiple highs and lows with two trendlines) on December 3. Still, it failed to sustain its upward momentum, correcting and finding support near the upper trendline. ADA rose 3.71% on Monday and, at the time of writing on Tuesday, hovers around $0.43.
If ADA continues its upward trend, it could extend the rally toward the next key resistance at $0.49.
The Relative Strength Index (RSI) on the daily chart is 43, pointing upward toward the neutral 50 level, indicating fading bearish momentum. For the bullish momentum to be sustained, the RSI must move above its neutral level. The Moving Average Convergence Divergence (MACD) showed a bullish crossover last week, which remains intact and supports the bullish view.
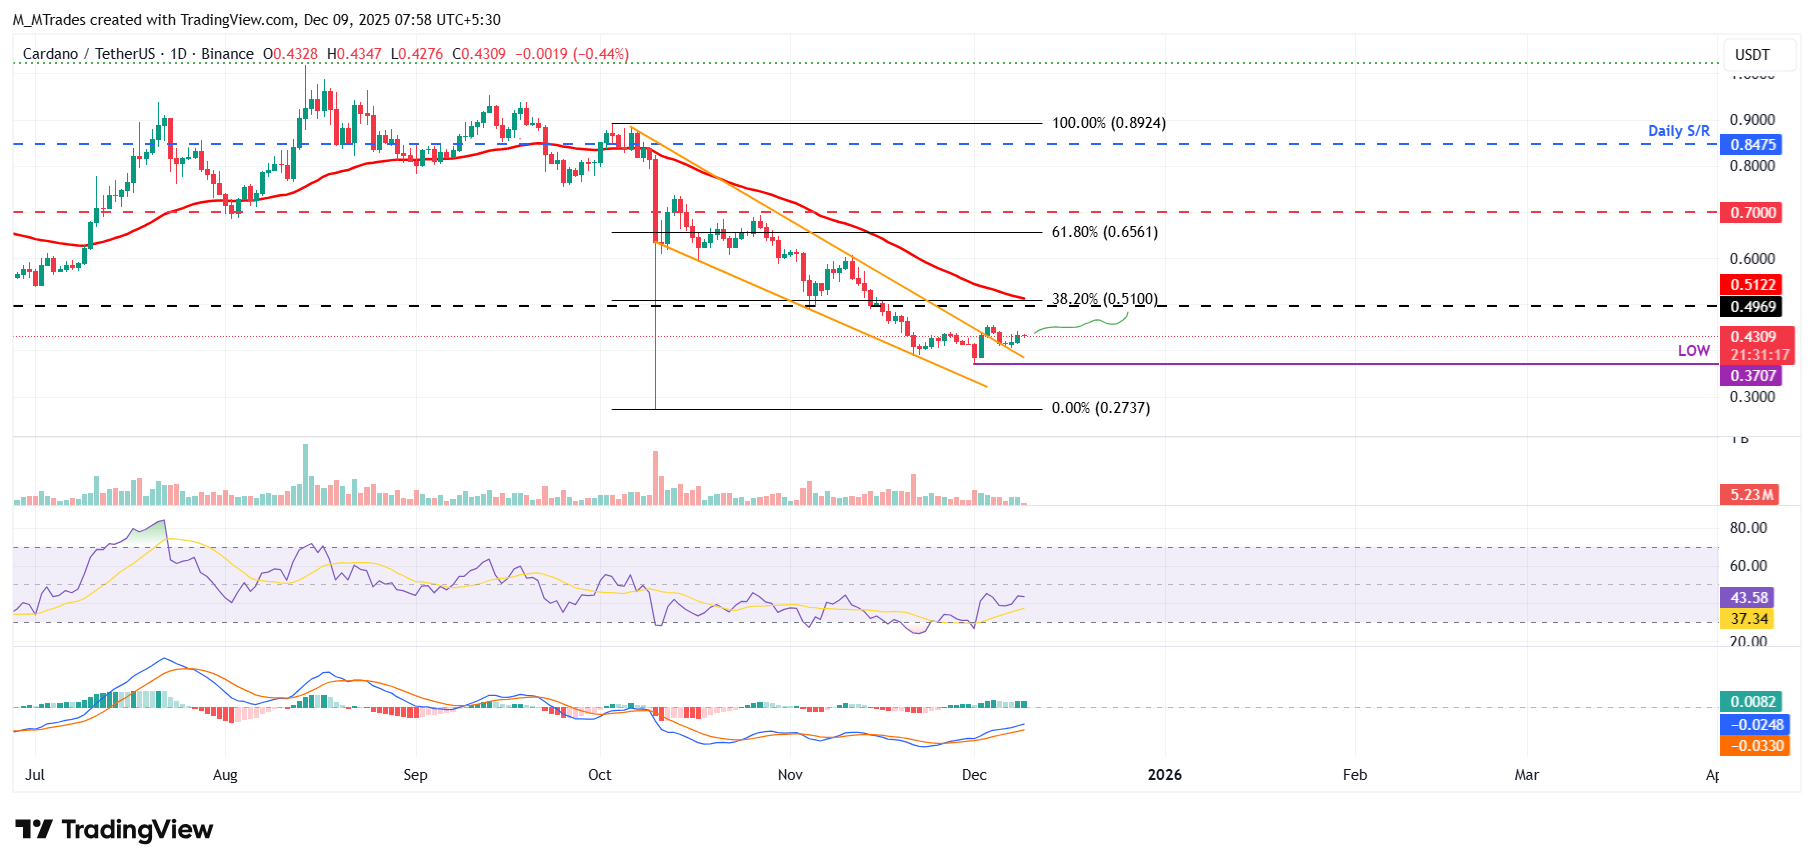
On the other hand, if ADA faces a correction, it could extend the decline toward the December 1 low $0.37.
บทความแนะนำ


