

Crypto Today: Bitcoin, Ethereum, XRP offer recovery signals as bearish September sentiment spreads
- Bitcoin holds above $109,000, reflecting reduced institutional and retail demand amid macroeconomic uncertainty.
- Ethereum shows signs of recovery, backed by institutional demand and ETF inflows exceeding the $1 billion mark last week.
- XRP futures Open Interest holds near $8 billion, indicating relatively elevated interest as the price rebounds.
Bitcoin (BTC) price edges higher toward the $110,000 level on Monday following a weekend characterized by widespread drawdowns. Sentiment in the broader cryptocurrency market remains largely unstable, as investors fear that the downtrend in August may continue into September.
September has historically been bearish for Bitcoin, and by extension, the cryptocurrency market. Apart from the two previous Septembers, where BTC recorded returns of 7.3% and 3.9%, the bearish streak dates back to 2017.
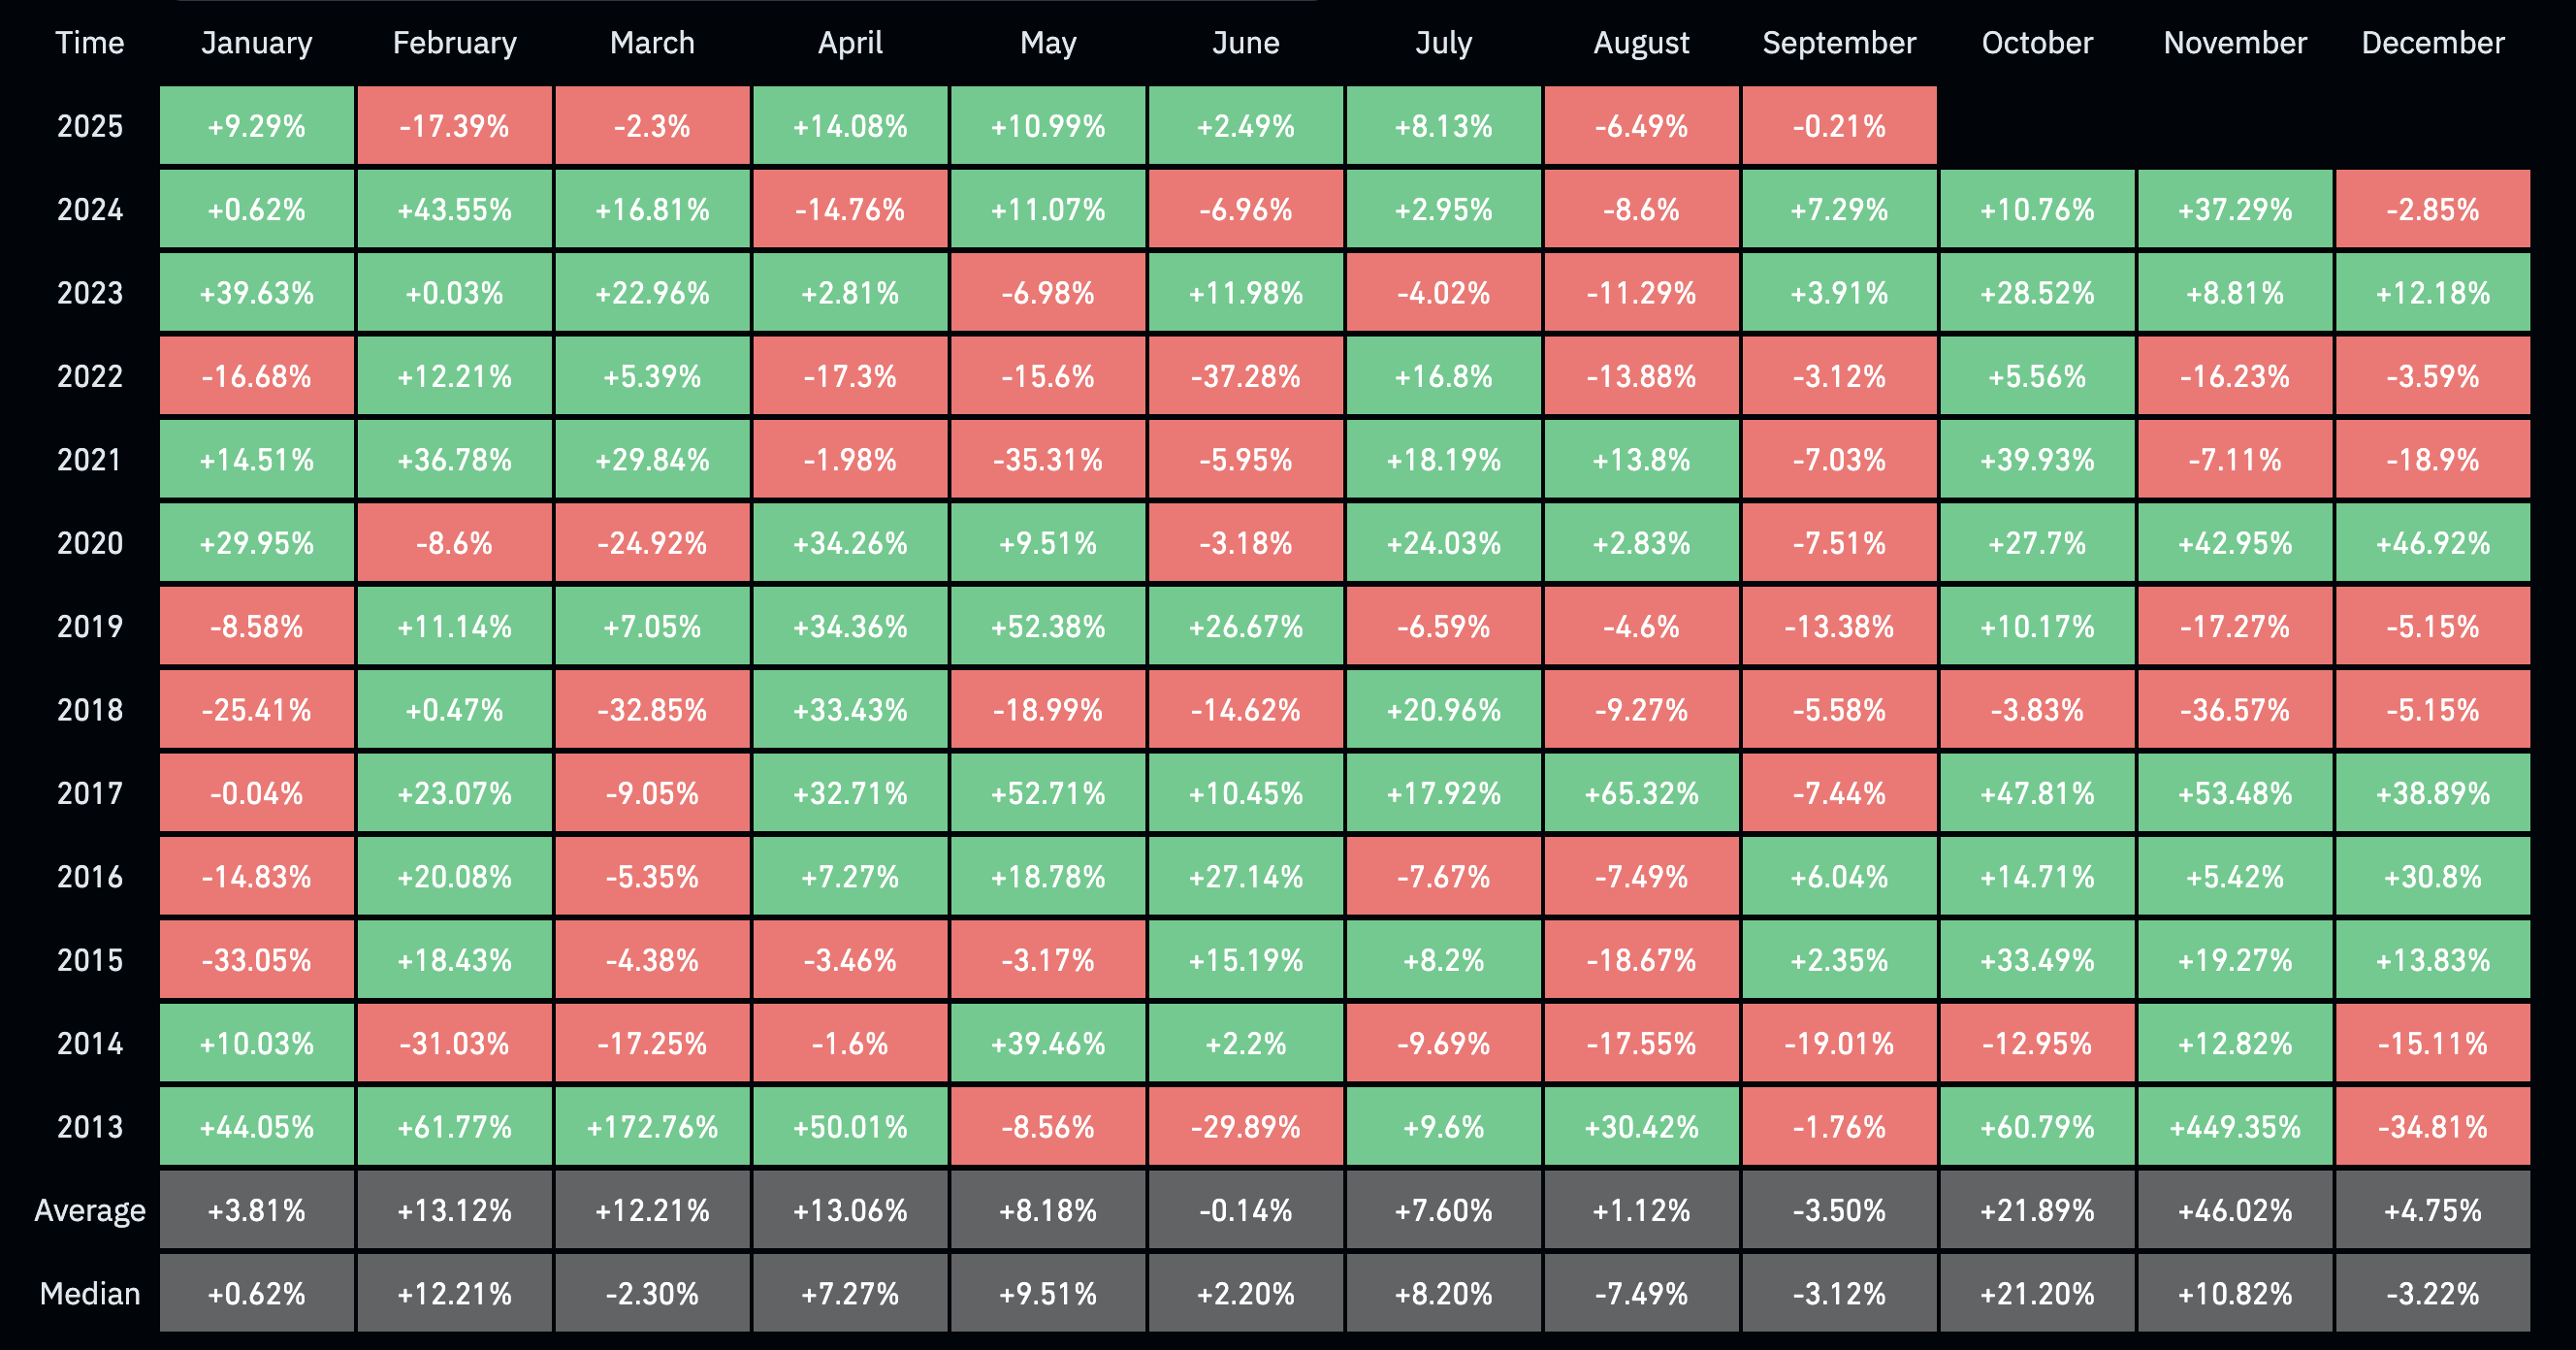
Bitcoin monthly returns data | Source: CoinGlass
Market participants will continue to closely monitor incoming economic data over the next two weeks as they gauge sentiment ahead of the Federal Reserve's (Fed) September interest rate decision.
According to the CME Fedwatch tool, there is an 87.6% chance that the Fed will cut interest rates by 25 basis points (bps) to a range of 4% to 4.25% – a potential lifeline for risk asset classes, such as crypto and Equities.
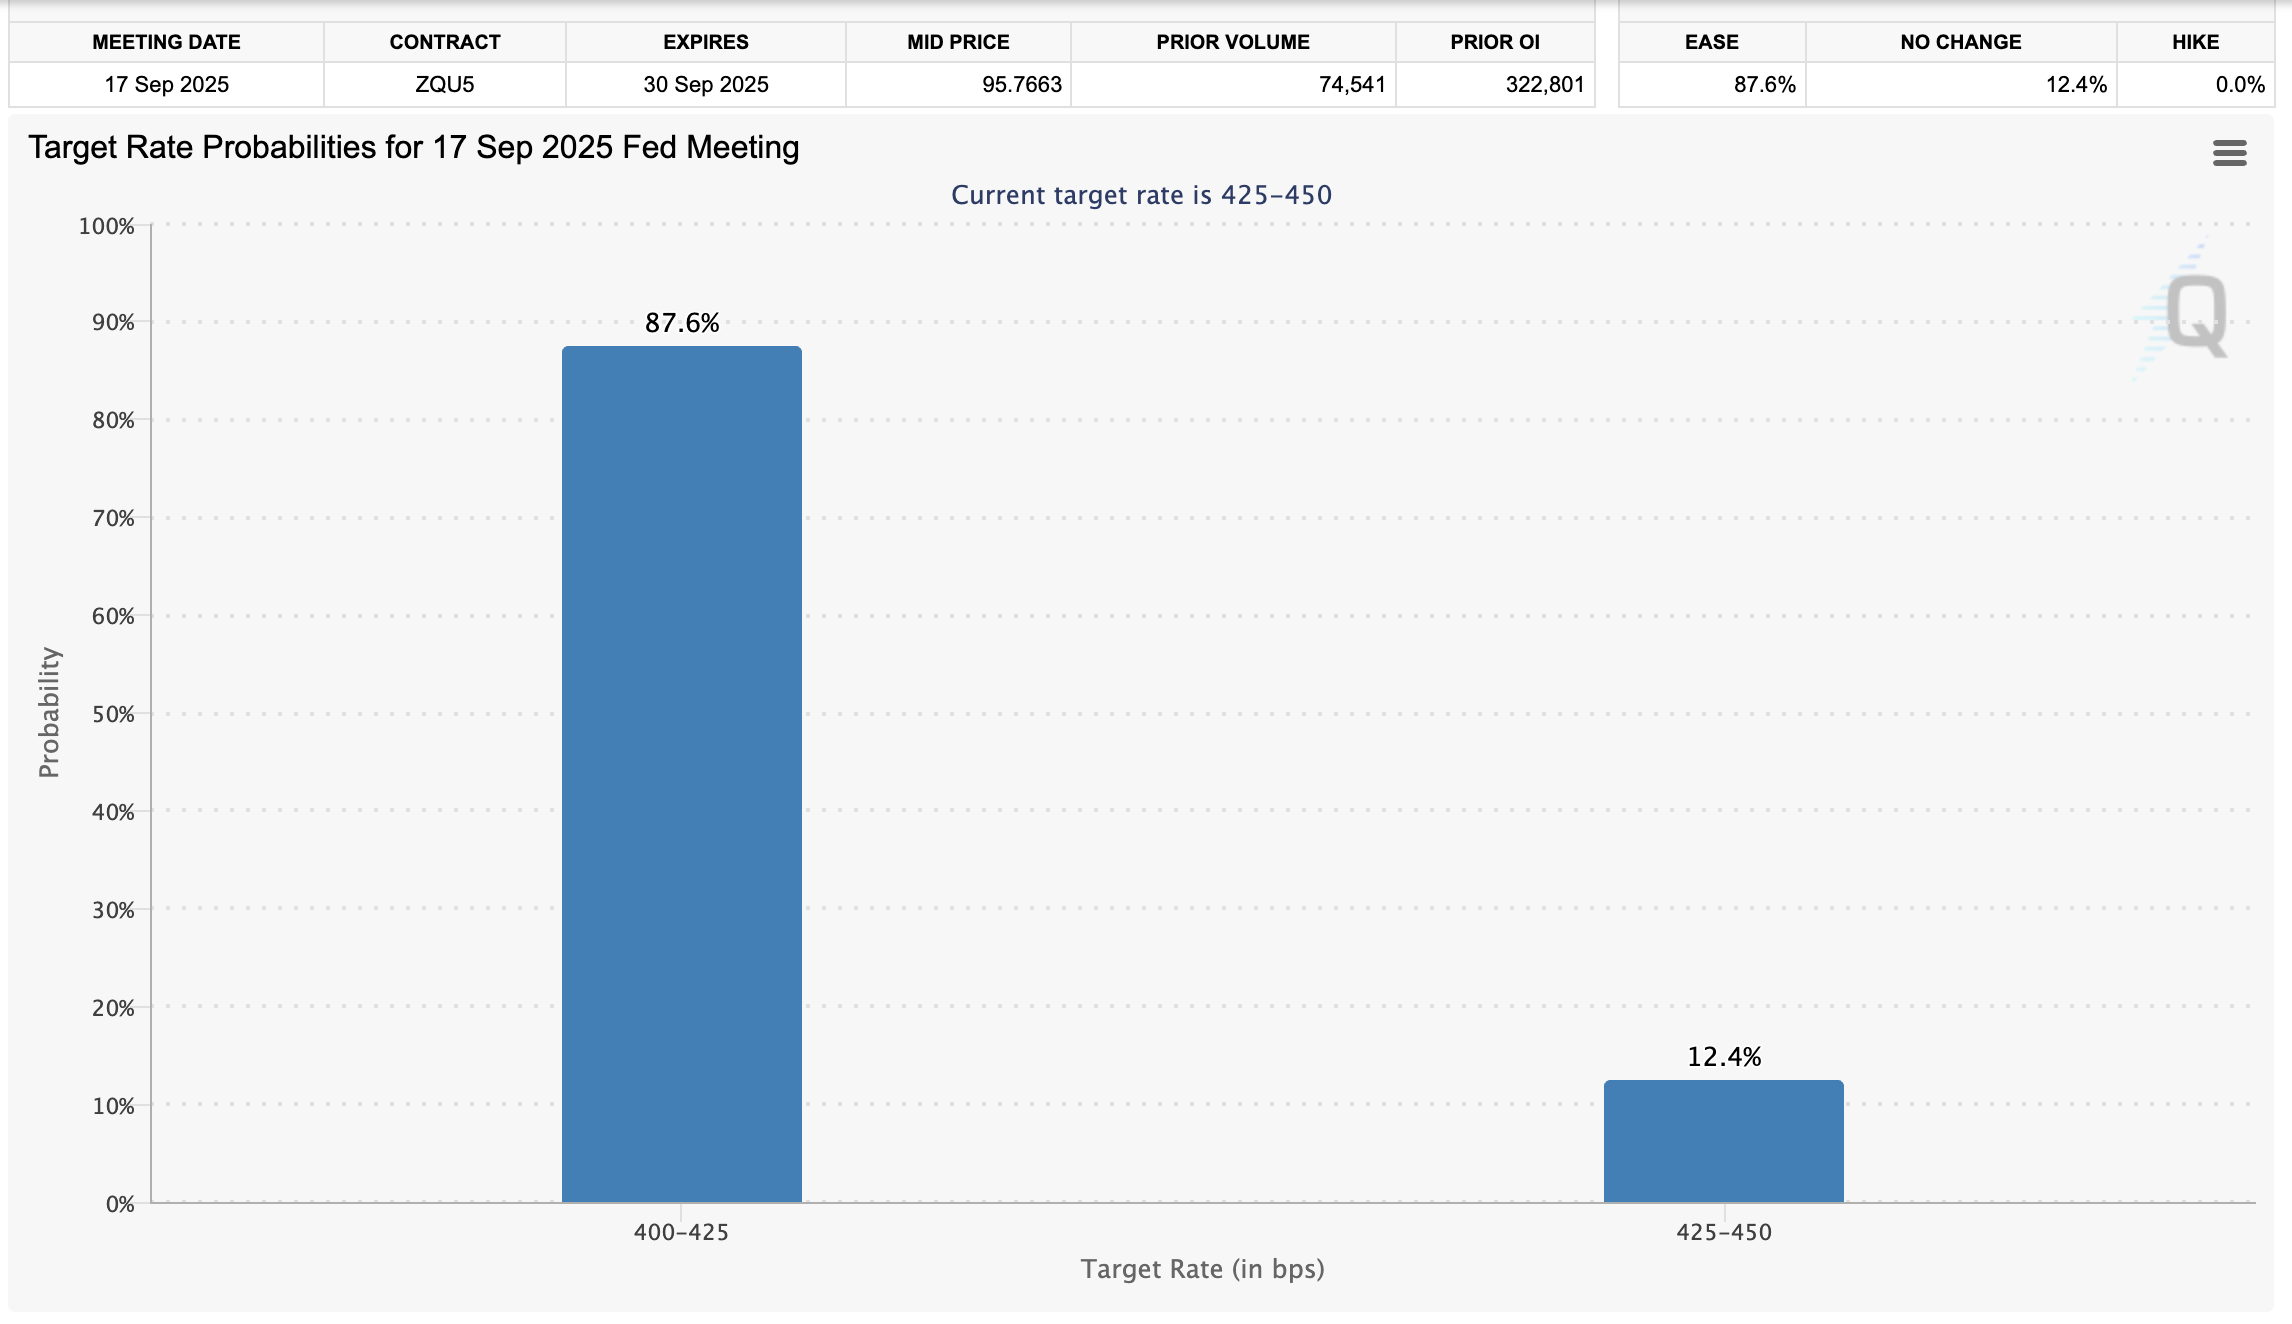
Fedwatch Tool | Source: CME Group
Data spotlight: Ethereum leads in weekly ETF inflows
Ethereum (ETH) continues to dominate capital inflows into digital investment products, with spot Exchange Traded Funds (ETFs) recording $1.08 billion in net inflows last week.
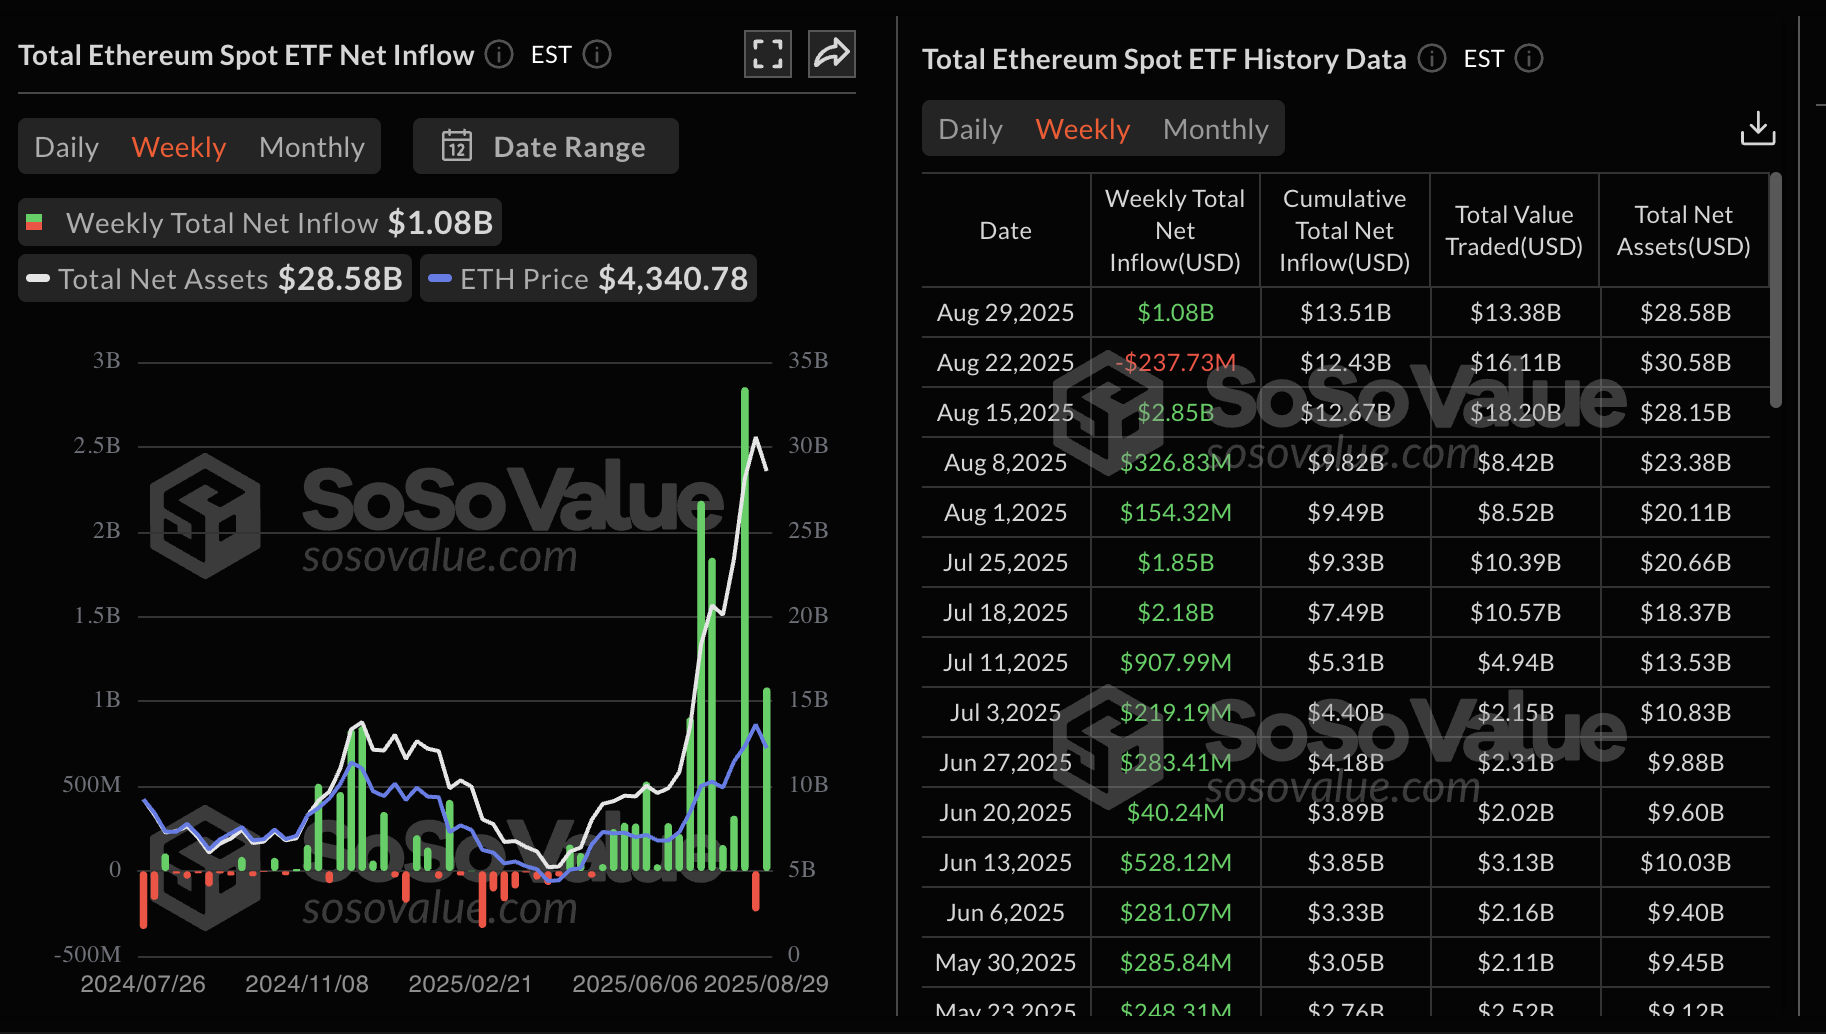
Ethereum spot ETF stats | Source: SoSoValue
According to SoSoValue, inflows into BTC spot ETFs operating in the United States (US) averaged at $441 million, marking a significant improvement from the previous week's $1.17 billion in outflows.
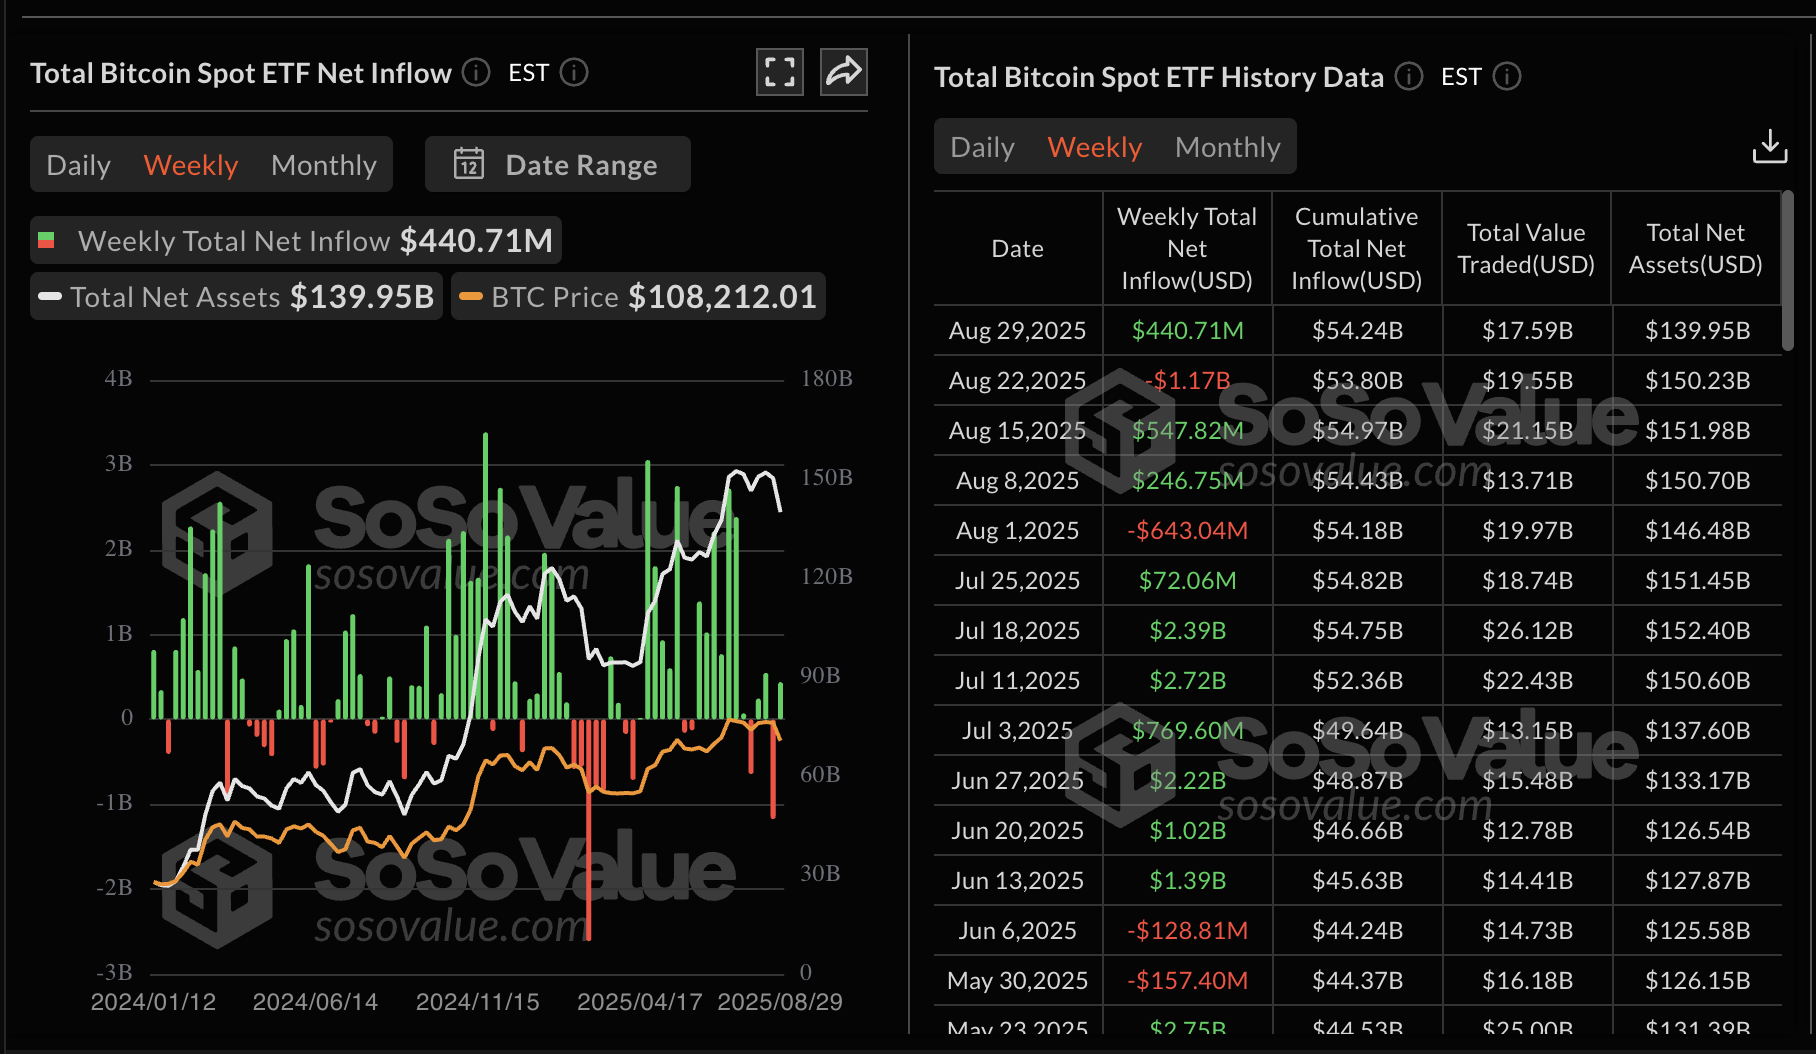
Bitcoin spot ETF stats | Source: SoSoValue
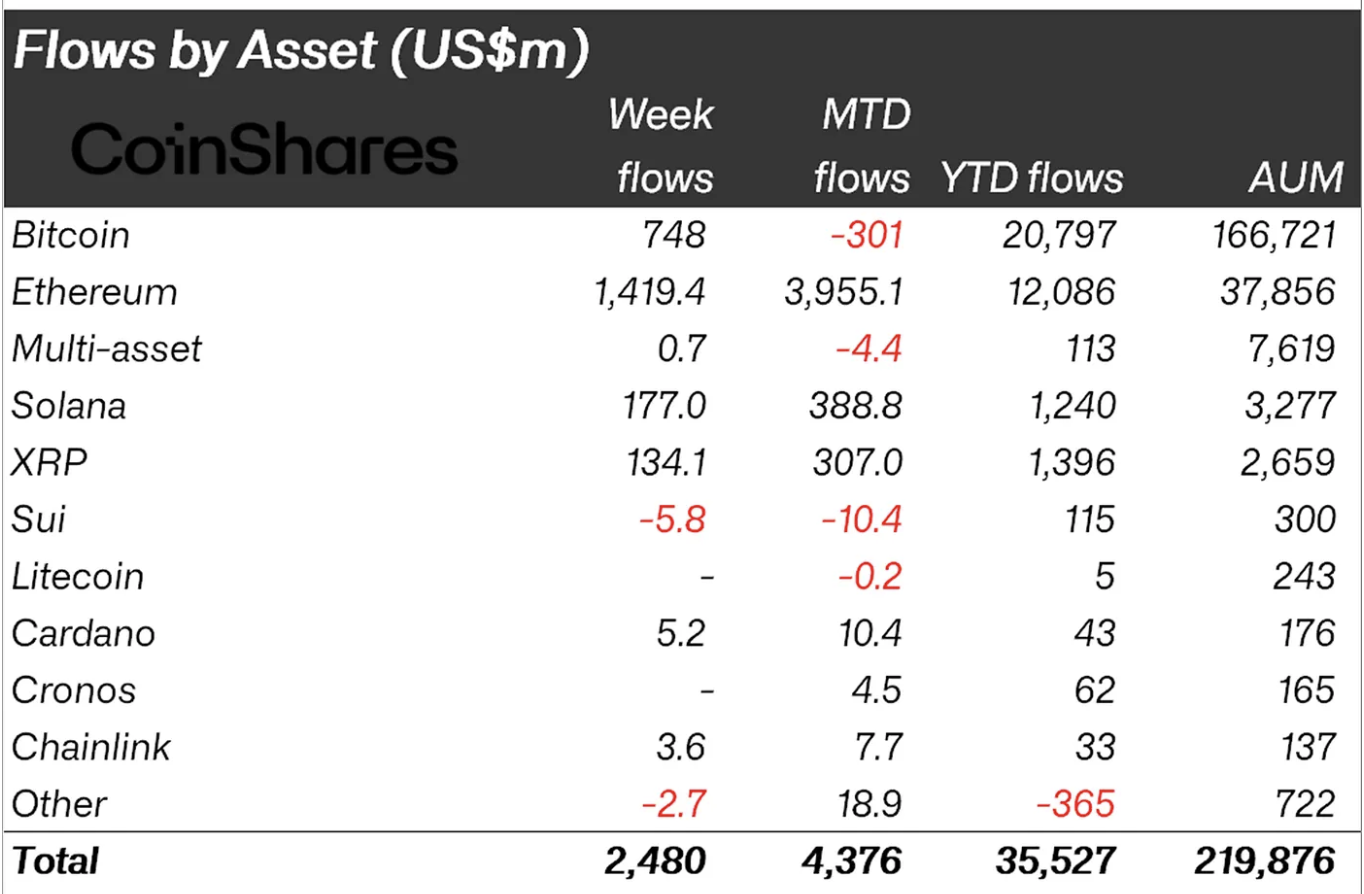
In total, digital assets saw inflows of $2.48 billion last week, bringing August inflows to $4.37 billion, according to CoinShares. The year-to-date (YTD) inflows average $35.5 billion, with cumulative assets under management (AUM) standing at $219 billion, down 10% from their recent peak.
"Ethereum led with $1.4 billion versus Bitcoin's $748 million; for August, Ethereum added $3.95 billion while Bitcoin lost $301 million, with Solana and XRP boosted by US ETF optimism," CoinShared highlighted.
Digital assets capital inflows | Source: CoinShares
As for Ripple (XRP), retail interest in the cross-border money remittance token remains relatively elevated near the $8 billion mark. Traders will be watching the Open Interest (OI), which represents the notional value of outstanding futures contracts, to gauge market sentiment and optimism.
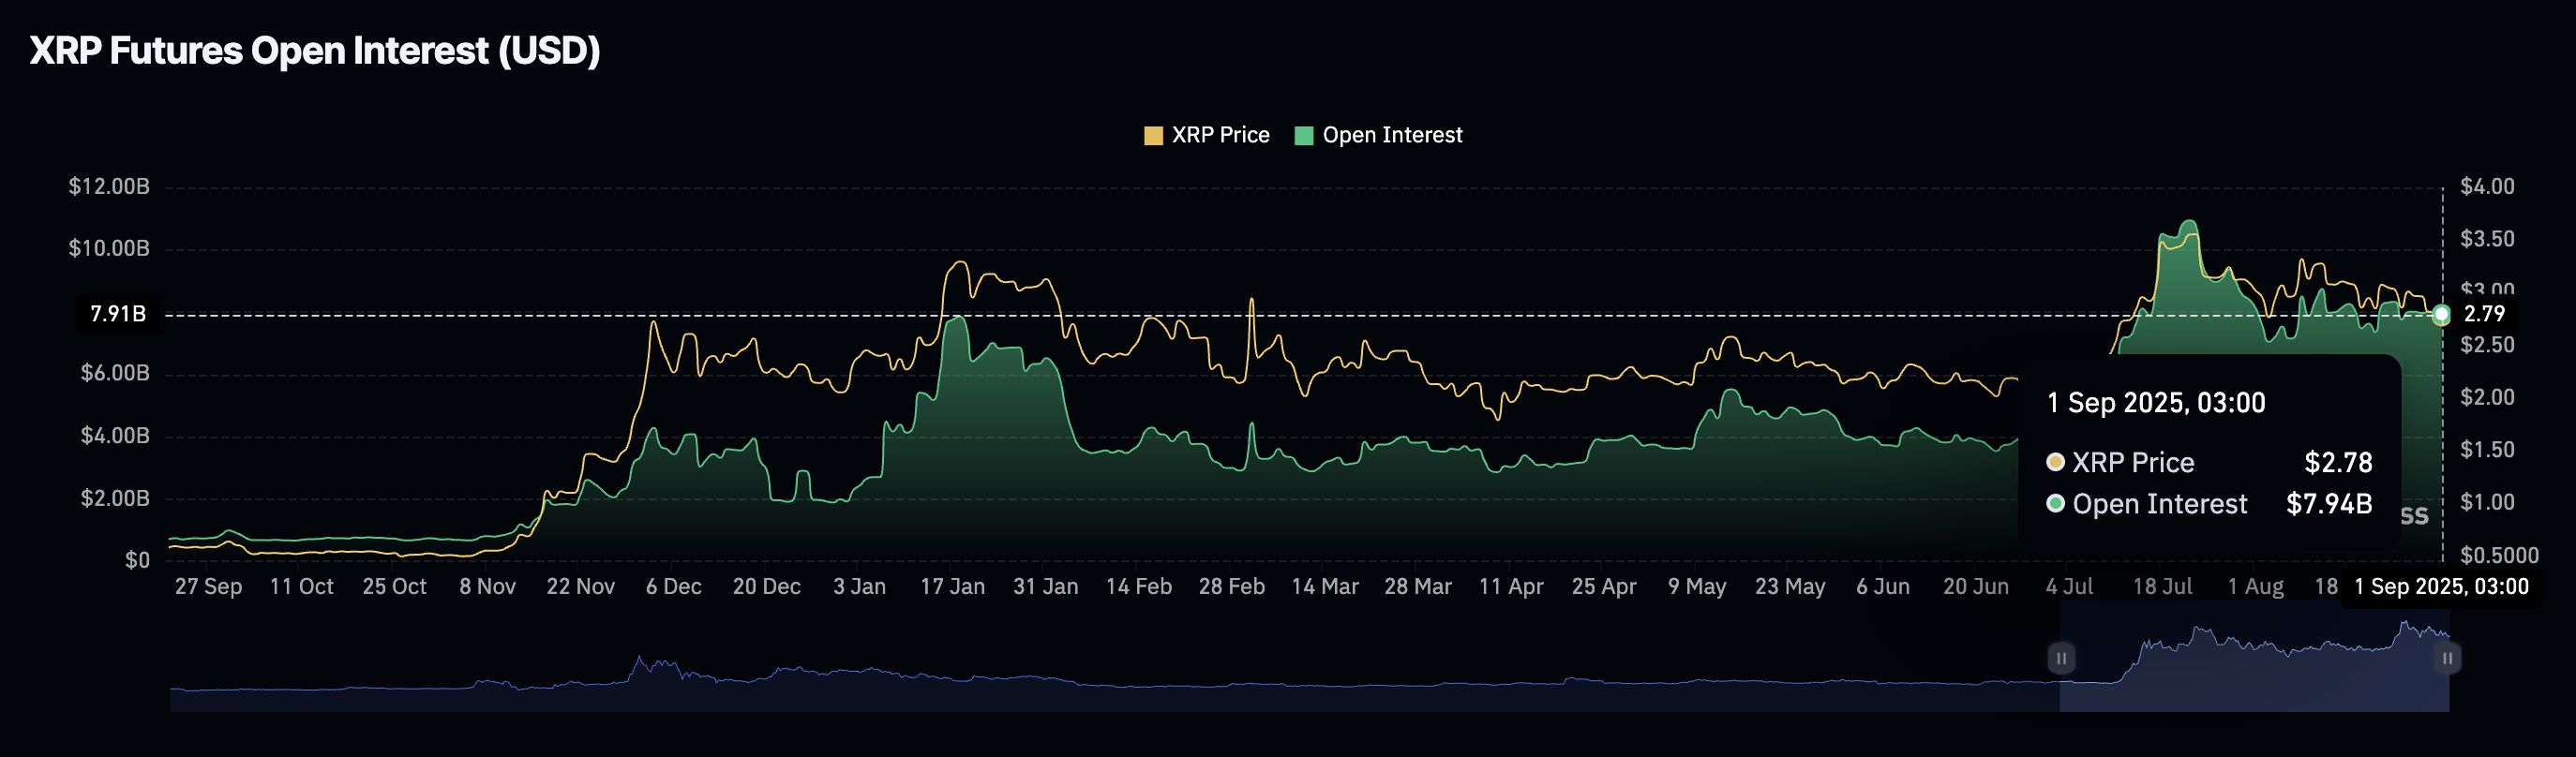
XRP Futures Open Interest | Source: CoinGlass
Chart of the day: Bitcoin rebounds nearing $110,000
Bitcoin price is trading above $109,500 at the time of writing, as bulls push for a recovery above the $110,000 round-number resistance. Before this knee-jerk reversal, BTC edged closer to $107,000, reflecting concerns about a historically bearish September.
The Relative Strength Index (RSI) at 41 and rising toward the midline on the daily chart backs the uptrend as bearish momentum decreases. An extended rebound targeting overbought territory would boost risk-on sentiment and increase the chances of Bitcoin closing the gap to $120,000 in September.
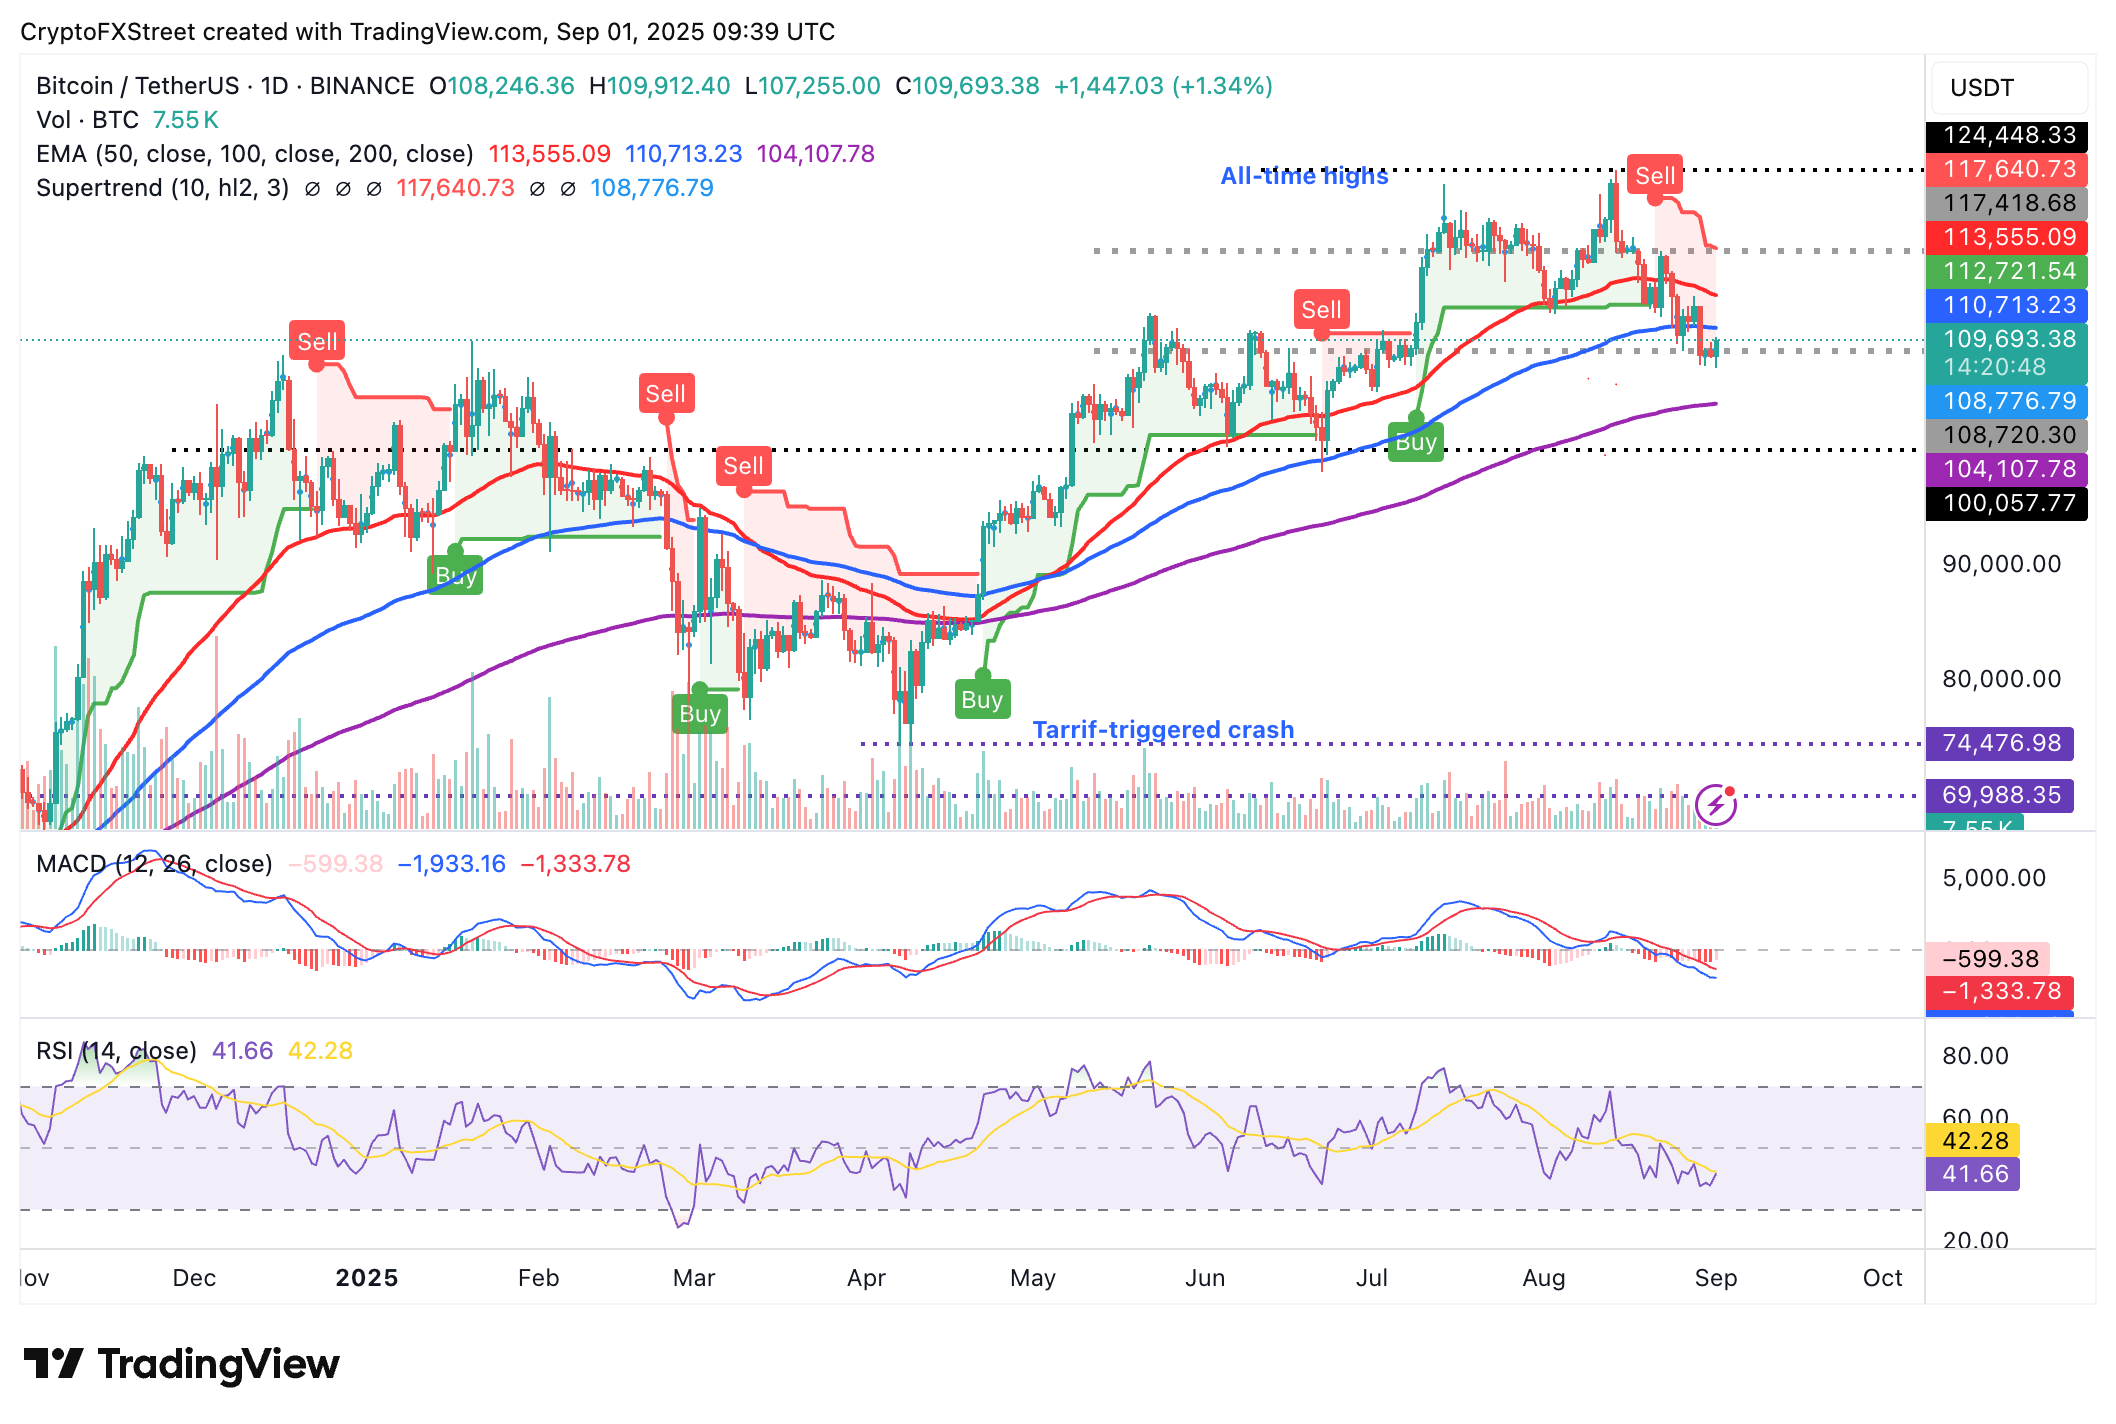
BTC/USDT daily chart
Still, a sell signal from the Moving Average Convergence Divergence (MACD) indicator since mid-August implies that the price of BTC is not yet out of the woods and that the decline could resume toward the 200-day Exponential Moving Average (EMA) at $104,107.
Altcoins update: Ethereum, XRP eye early month trend reversal
Ethereum price is attempting a recovery, edging closer to the $4,500 mark after falling to $4,257 on Saturday. The token's recovery is hinged to the steady interest and demand from institutions buying US ETH spot ETFs and growing strategic corporate treasuries.
The RSI at 54 backs the rebound as it rises above the midline. Ethereum is also positioned above key moving averages, including the 50-day EMA at $4,004, the 100-day EMA at $3,517 and the 200-day EMA at $3,120, all of which would serve as tentative support levels if Ethereum accelerates the decline.
A daily close above the immediate $4,500 round-figure resistance could reinforce the bullish grip and increase the probability of Ethereum price reaching its August 24 record high of $4,956.
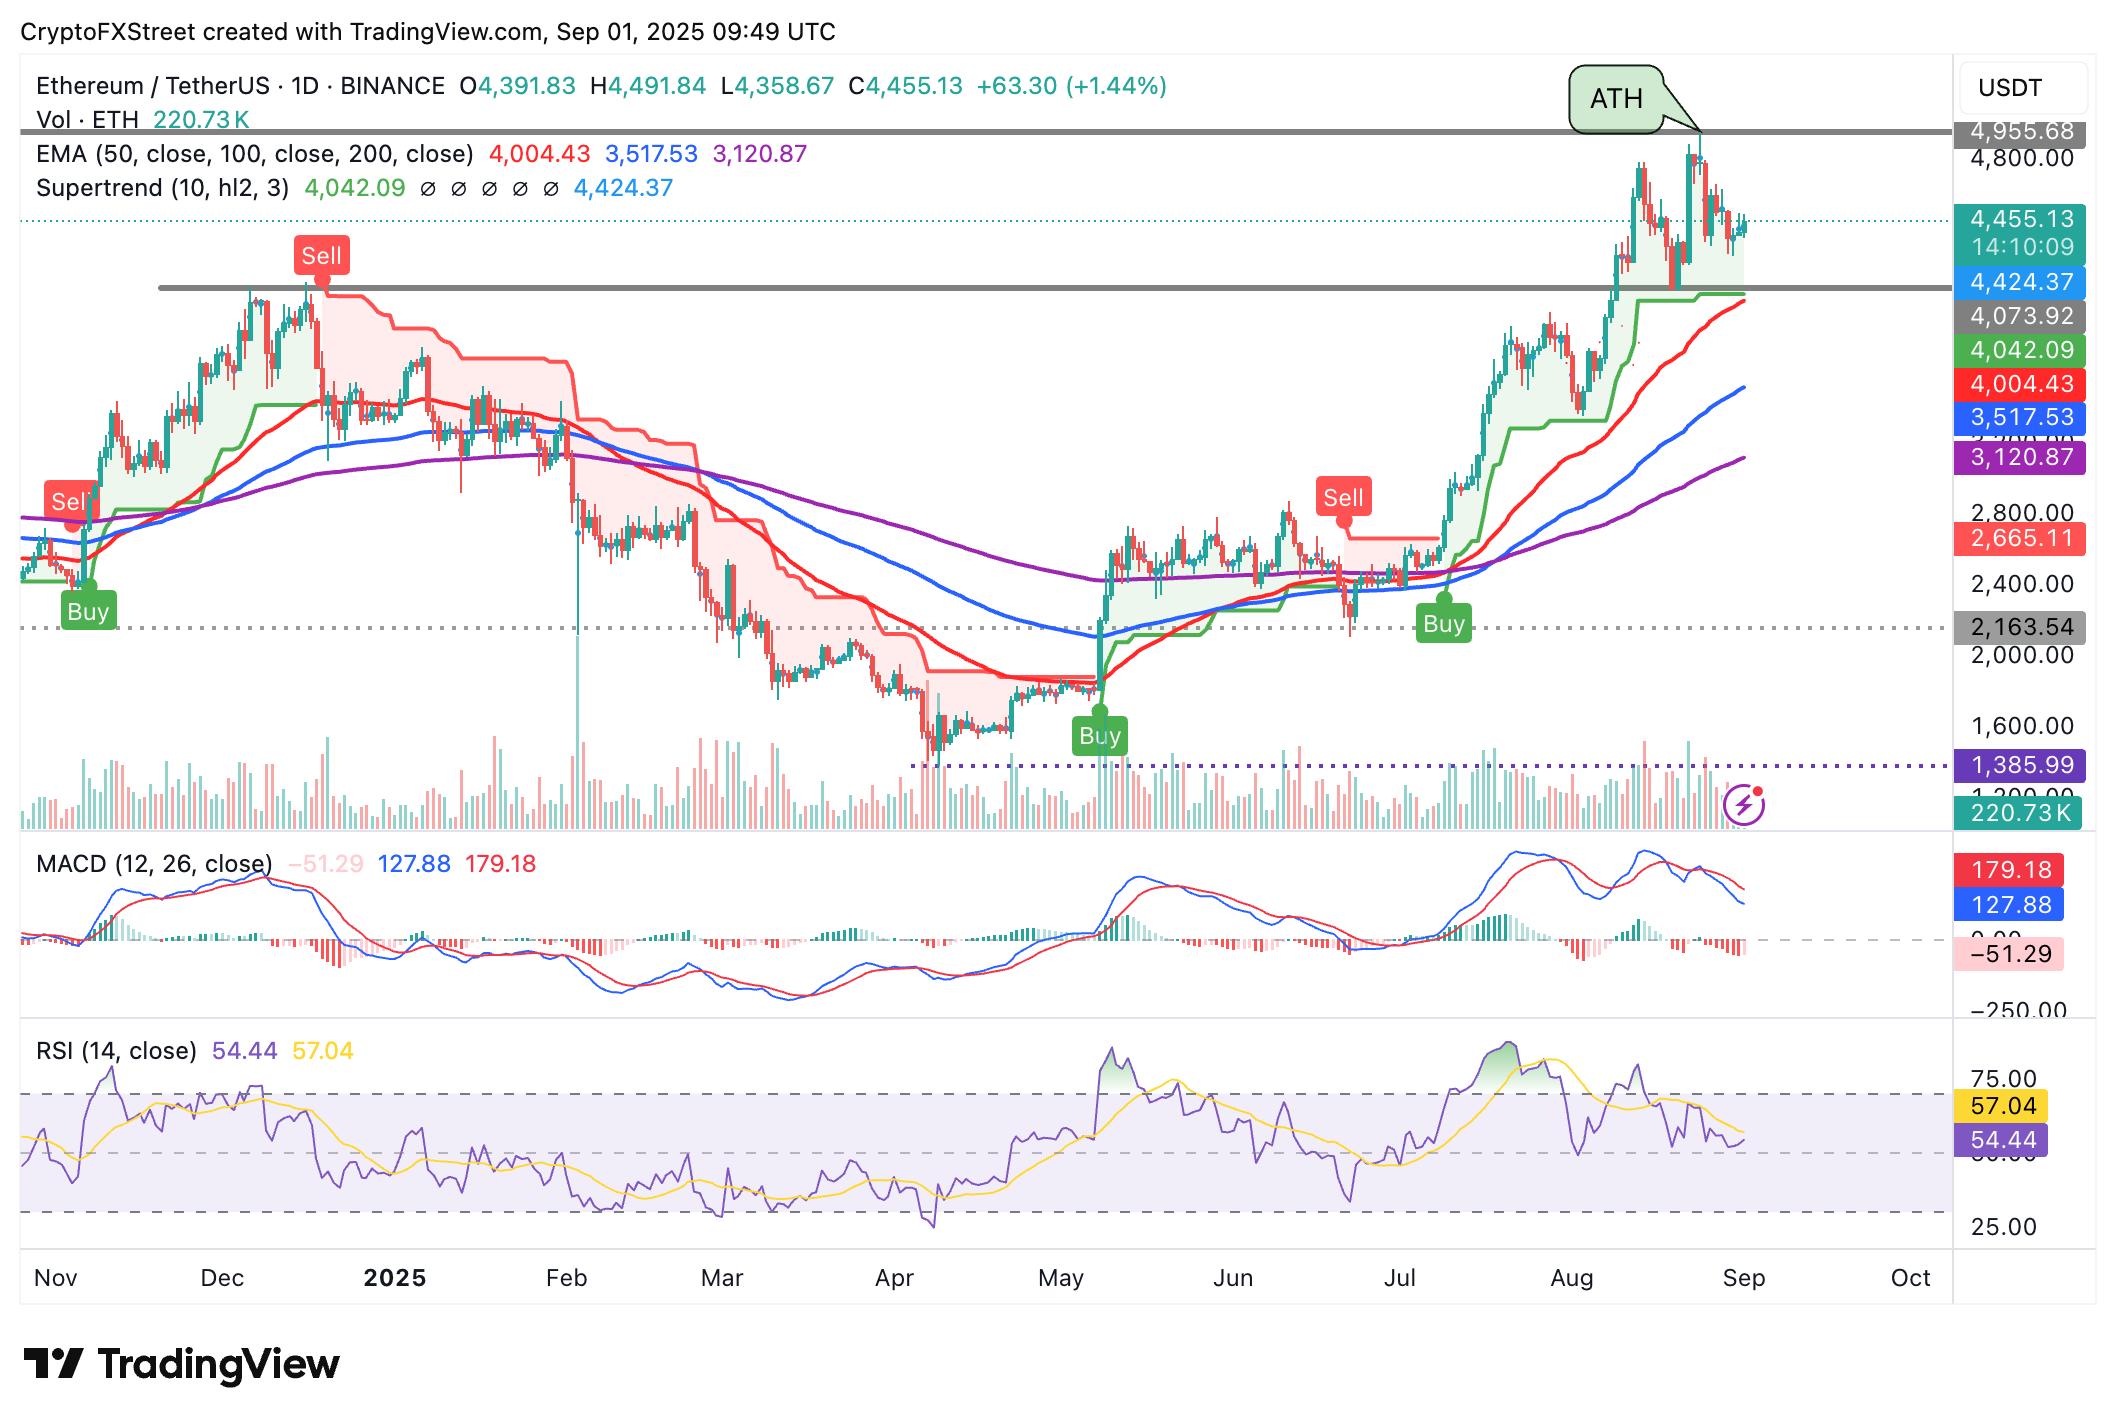
ETH/USDT daily chart
As for XRP, its short-term technical structure presents subtle bullish signals, starting with the RSI at 40, which is rising and aiming for the midline. A steady increase in the RSI would boost buying pressure and increase the chances of the XRP price toppling the $3.00 resistance.
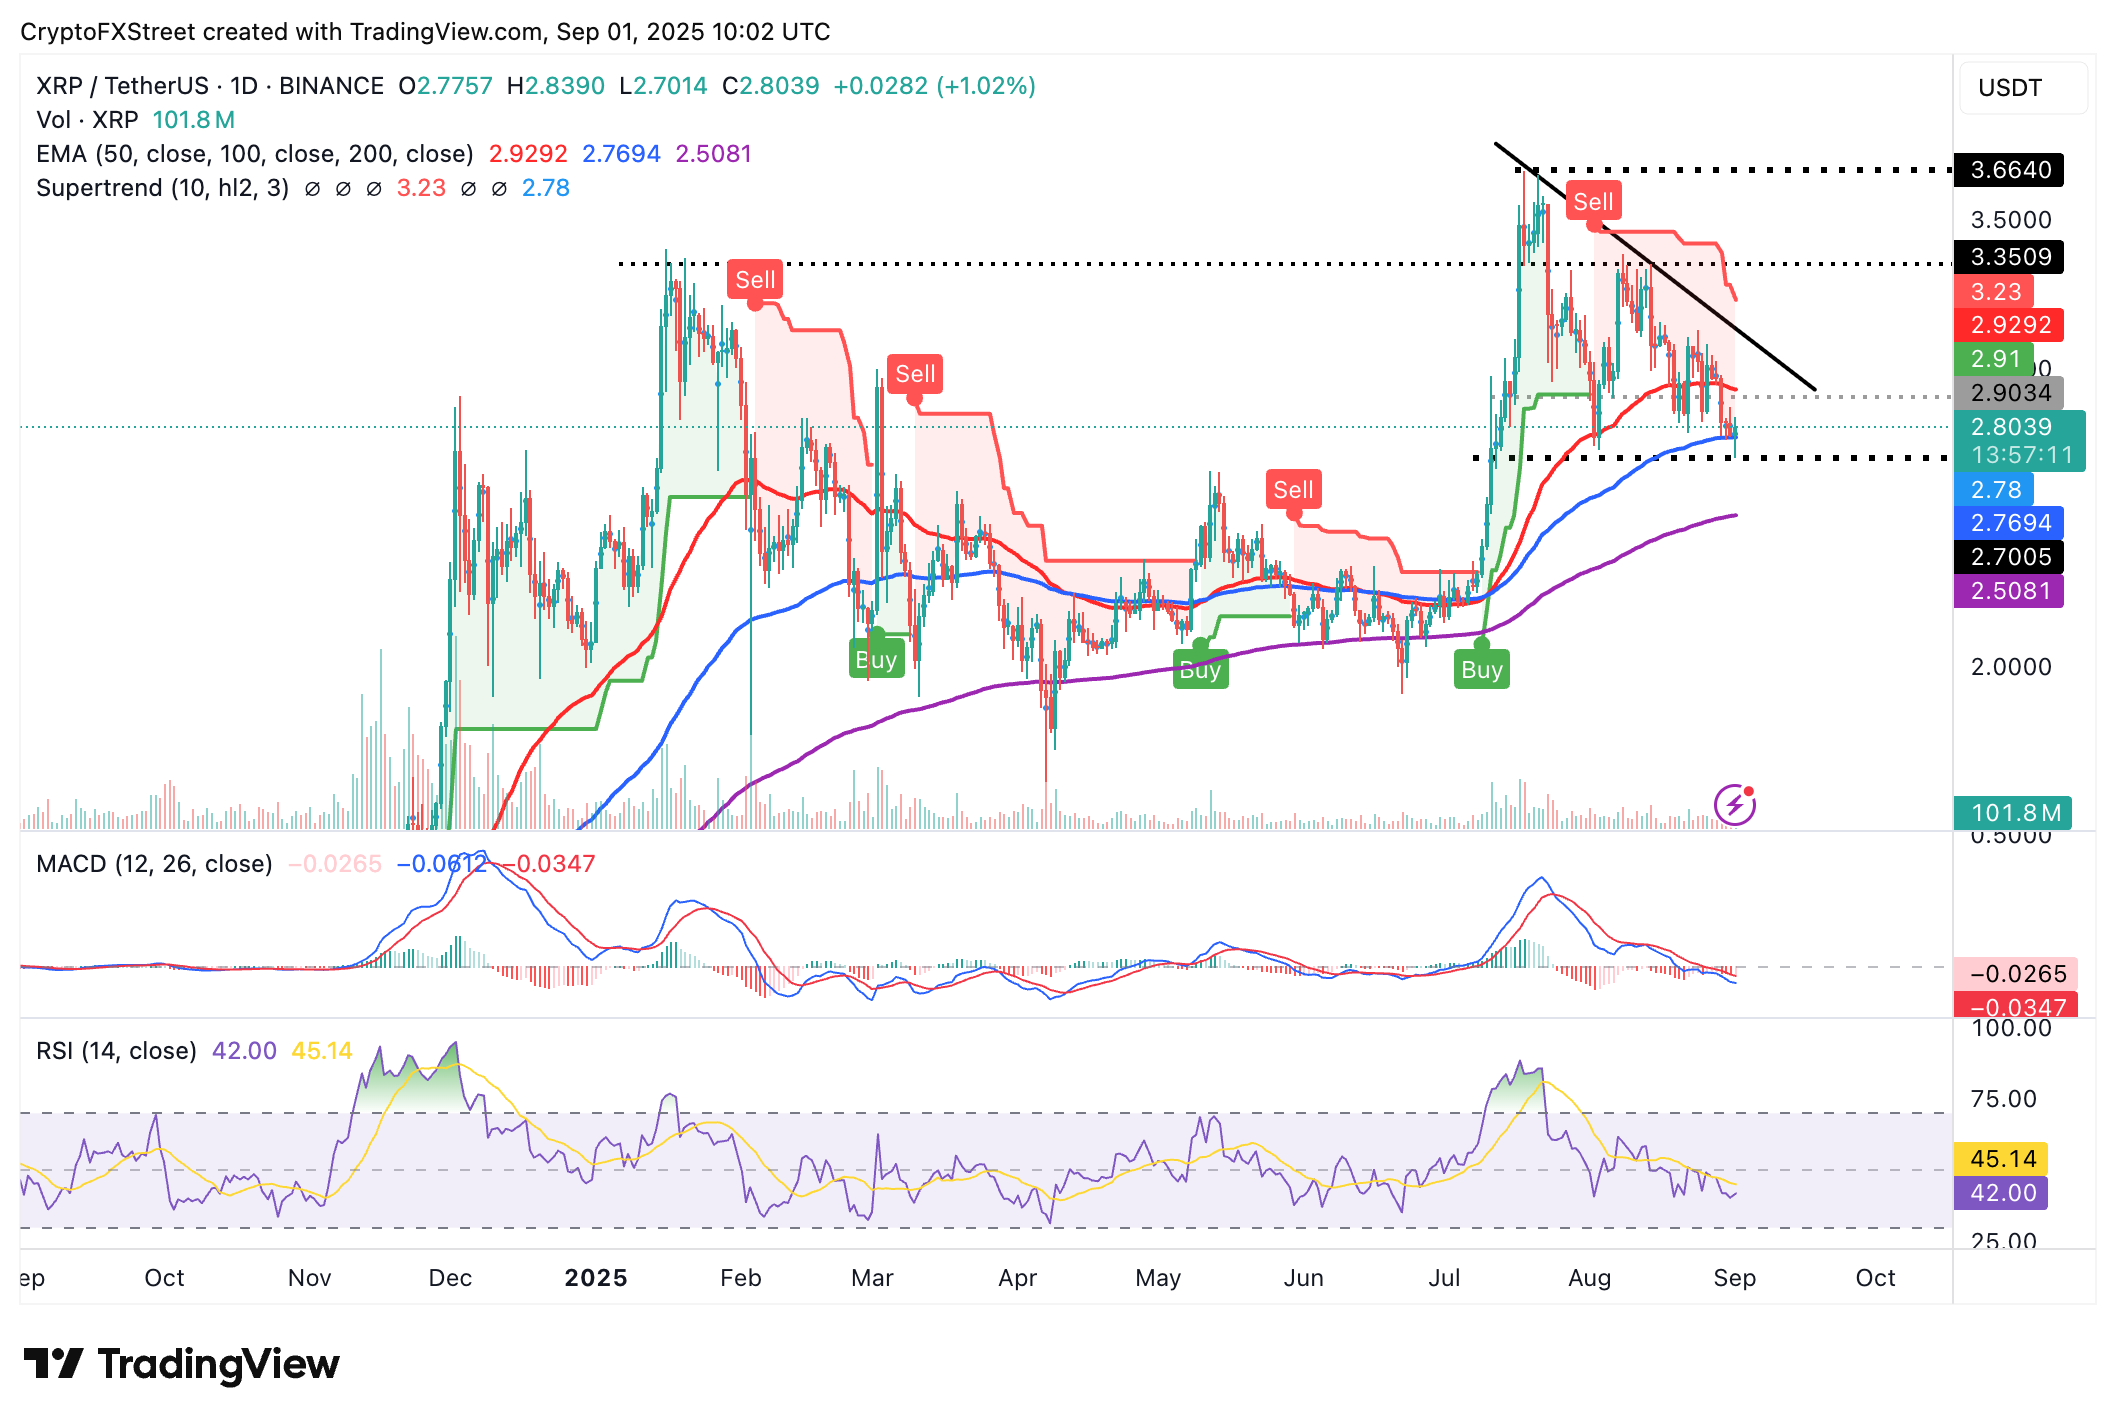
XRP/USDT daily chart
The MACD indicator displays a sell signal, suggesting that overhead pressure could overwhelm demand if traders continue to de-risk by reducing their exposure. Key areas of interest for traders include the 100-day EMA at $2.76 and the 200-day EMA at $2.50.
Bitcoin, altcoins, stablecoins FAQs
Bitcoin is the largest cryptocurrency by market capitalization, a virtual currency designed to serve as money. This form of payment cannot be controlled by any one person, group, or entity, which eliminates the need for third-party participation during financial transactions.
Altcoins are any cryptocurrency apart from Bitcoin, but some also regard Ethereum as a non-altcoin because it is from these two cryptocurrencies that forking happens. If this is true, then Litecoin is the first altcoin, forked from the Bitcoin protocol and, therefore, an “improved” version of it.
Stablecoins are cryptocurrencies designed to have a stable price, with their value backed by a reserve of the asset it represents. To achieve this, the value of any one stablecoin is pegged to a commodity or financial instrument, such as the US Dollar (USD), with its supply regulated by an algorithm or demand. The main goal of stablecoins is to provide an on/off-ramp for investors willing to trade and invest in cryptocurrencies. Stablecoins also allow investors to store value since cryptocurrencies, in general, are subject to volatility.
Bitcoin dominance is the ratio of Bitcoin's market capitalization to the total market capitalization of all cryptocurrencies combined. It provides a clear picture of Bitcoin’s interest among investors. A high BTC dominance typically happens before and during a bull run, in which investors resort to investing in relatively stable and high market capitalization cryptocurrency like Bitcoin. A drop in BTC dominance usually means that investors are moving their capital and/or profits to altcoins in a quest for higher returns, which usually triggers an explosion of altcoin rallies.
บทความแนะนำ


