
Australian Dollar holds steady after improved S&P Global PMI data
- The Australian Dollar moves little following the release of preliminary S&P Global Purchasing Managers Index data.
- Australia's S&P Global Manufacturing PMI rose to 52.9, while Services PMI climbed to 55.1 in August.
- FOMC Meeting Minutes suggested that most members considered the decision appropriate to maintain the interest rates.
The Australian Dollar (AUD) depreciates against the US Dollar (USD) on Thursday, extending its losses for the fourth successive day. The AUD/USD pair remains subdued despite the release of the improved preliminary data of S&P Global Australia’s Purchasing Managers Index (PMI). Furthermore, the preliminary S&P Global US Purchasing Managers Index (PMI) reports will be eyed later in the day.
Australia's S&P Global Manufacturing PMI came in at 52.9 in August, against 51.3 prior. Meanwhile, Services PMI rose to 55.1 from the previous reading of 54.1. The Composite PMI improved to 54.9 from 53.8 previously. However, Australia’s Consumer Inflation Expectations rose 3.9% in August, against the previous rise of 4.7%.
The Federal Open Market Committee’s (FOMC) Minutes for the July 29-30 meeting indicated that most Federal Reserve (Fed) officials emphasized that inflation risks outweighed labor market concerns during last month’s meeting, as tariffs deepened divisions among policymakers. Most policymakers considered it appropriate to maintain the benchmark interest rate in the 4.25%–4.50% range.
Australian Dollar remains subdued as US Dollar steadies ahead of Powell’s upcoming speech
- The US Dollar Index (DXY), which measures the value of the US Dollar against six major currencies, is holding ground and trading around 98.20 at the time of writing. Traders are awaiting Fed Chair Jerome Powell’s speech at the Jackson Hole Symposium in Wyoming on Friday, which may provide clues about the September policy decision.
- Fed funds futures traders are currently pricing in an 83% chance of a cut next month and 54 basis points (bps) of cuts by year-end, according to the CME FedWatch tool.
- White House press secretary Karoline Leavitt announced on Tuesday that plans for a bilateral meeting between Russian President Vladimir Putin and Ukrainian President Volodymyr Zelenskyy are now underway, according to CNN.
- US President Donald Trump said on Tuesday that there won’t be American troops on the ground to help enforce a potential peace deal in Ukraine. The terms of security guarantees are still being negotiated between the US, European partners, and Ukraine.
- The Trump administration has broadened its 50% tariffs on steel and aluminum imports, taking effect on August 18. Friday’s notification included 407 new product codes in the US Harmonized Tariff Schedule. US President Donald Trump also told reporters he intends to issue further announcements on steel tariffs, along with new levies aimed at semiconductor imports.
- The People’s Bank of China (PBOC) announced on Wednesday that it would leave its one- and five-year Loan Prime Rates (LPRs) unchanged at 3.00% and 3.50%, respectively.
- US Treasury Secretary Scott Bessent said late Monday that the talks between the United States (US) and China are going well, adding that he expects US growth to pick up in the fourth quarter (Q4). Bessent further noted that the current arrangement with China is highly effective, as the country remains the largest contributor to tariff revenue.
- Australia’s Westpac Consumer Confidence surged 5.7% in August to 98.5, following a 0.6% increase in July. The sentiment has reached a high since February 2022, as the Reserve Bank of Australia (RBA) has delivered rate cuts totaling 75 basis points since January. Matthew Hassan, Head of Australian Macro-Forecasting, said the prolonged period of consumer pessimism may be coming to an end, although maintaining momentum could require additional easing. However, he emphasized that policymakers are under no immediate pressure to deliver further cuts.
- The Reserve Bank of Australia (RBA) delivered a 25 basis points (bps) interest rate cut on Tuesday, as widely expected, bringing the Official Cash Rate (OCR) to 3.6% from 3.85% at the August policy meeting.
Australian Dollar tests two-month lows near 0.6400
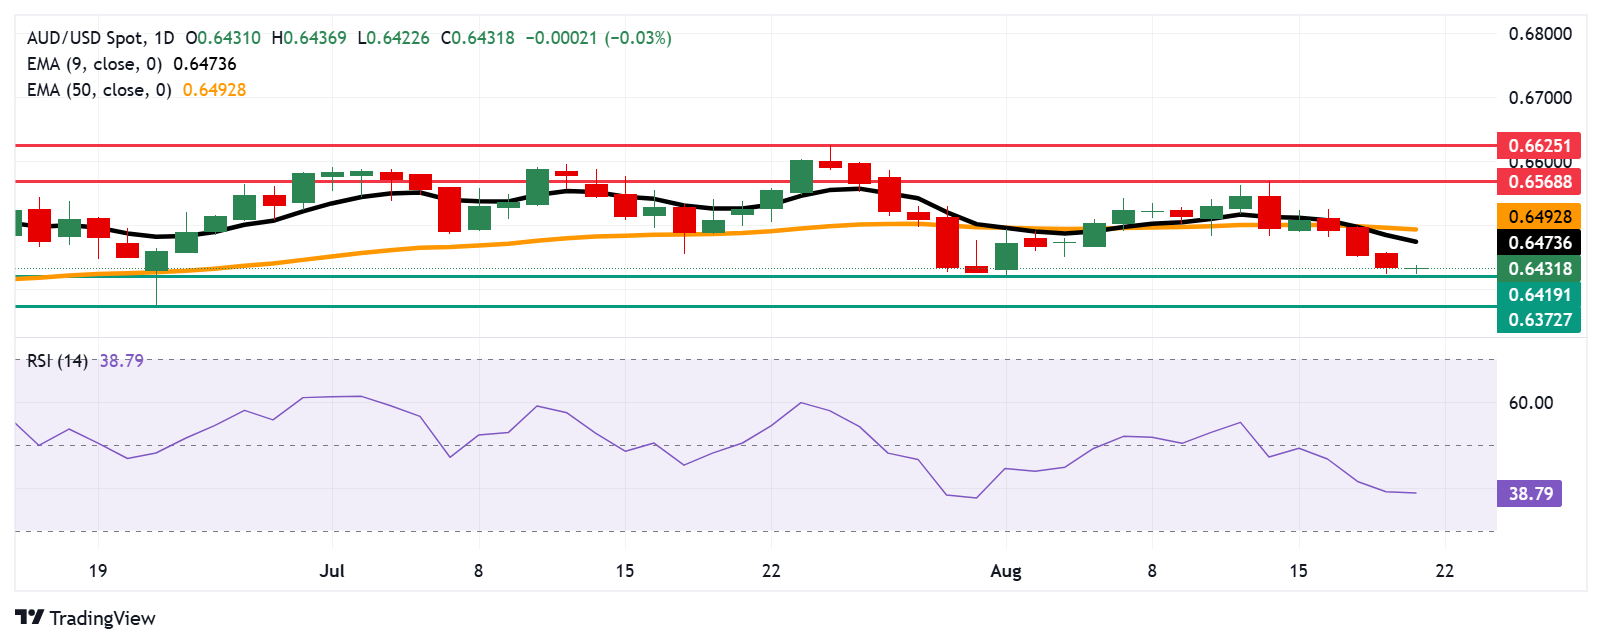
AUD/USD is trading around 0.6430 on Thursday. The technical analysis on the daily chart indicates that short-term price momentum is weakening as the pair remains below the nine-day Exponential Moving Average (EMA). Additionally, the 14-day Relative Strength Index (RSI) is positioned below the 50 level, indicating a bearish market bias.
On the downside, the AUD/USD pair could target the two-month low of 0.6419, recorded on August 1, followed by the three-month low of 0.6372, reached on June 23.
The primary barrier appears at the nine-day EMA of 0.6473, followed by the 50-day EMA at 0.6492. A break above this crucial resistance zone could improve the short- and medium-term price momentum and prompt the AUD/USD pair to target the monthly high at 0.6568, reached on August 14, followed by the nine-month high of 0.6625, which was recorded on July 24.
AUD/USD: Daily Chart
Australian Dollar PRICE Today
The table below shows the percentage change of Australian Dollar (AUD) against listed major currencies today. Australian Dollar was the weakest against the New Zealand Dollar.
| USD | EUR | GBP | JPY | CAD | AUD | NZD | CHF | |
|---|---|---|---|---|---|---|---|---|
| USD | 0.04% | -0.00% | 0.09% | 0.02% | 0.00% | -0.17% | 0.11% | |
| EUR | -0.04% | -0.07% | 0.02% | -0.04% | 0.02% | -0.17% | 0.05% | |
| GBP | 0.00% | 0.07% | 0.10% | 0.03% | 0.09% | -0.10% | 0.13% | |
| JPY | -0.09% | -0.02% | -0.10% | -0.06% | -0.07% | -0.22% | 0.07% | |
| CAD | -0.02% | 0.04% | -0.03% | 0.06% | -0.04% | -0.21% | 0.09% | |
| AUD | -0.00% | -0.02% | -0.09% | 0.07% | 0.04% | -0.11% | 0.12% | |
| NZD | 0.17% | 0.17% | 0.10% | 0.22% | 0.21% | 0.11% | 0.23% | |
| CHF | -0.11% | -0.05% | -0.13% | -0.07% | -0.09% | -0.12% | -0.23% |
The heat map shows percentage changes of major currencies against each other. The base currency is picked from the left column, while the quote currency is picked from the top row. For example, if you pick the Australian Dollar from the left column and move along the horizontal line to the US Dollar, the percentage change displayed in the box will represent AUD (base)/USD (quote).
Australian Dollar FAQs
One of the most significant factors for the Australian Dollar (AUD) is the level of interest rates set by the Reserve Bank of Australia (RBA). Because Australia is a resource-rich country another key driver is the price of its biggest export, Iron Ore. The health of the Chinese economy, its largest trading partner, is a factor, as well as inflation in Australia, its growth rate and Trade Balance. Market sentiment – whether investors are taking on more risky assets (risk-on) or seeking safe-havens (risk-off) – is also a factor, with risk-on positive for AUD.
The Reserve Bank of Australia (RBA) influences the Australian Dollar (AUD) by setting the level of interest rates that Australian banks can lend to each other. This influences the level of interest rates in the economy as a whole. The main goal of the RBA is to maintain a stable inflation rate of 2-3% by adjusting interest rates up or down. Relatively high interest rates compared to other major central banks support the AUD, and the opposite for relatively low. The RBA can also use quantitative easing and tightening to influence credit conditions, with the former AUD-negative and the latter AUD-positive.
China is Australia’s largest trading partner so the health of the Chinese economy is a major influence on the value of the Australian Dollar (AUD). When the Chinese economy is doing well it purchases more raw materials, goods and services from Australia, lifting demand for the AUD, and pushing up its value. The opposite is the case when the Chinese economy is not growing as fast as expected. Positive or negative surprises in Chinese growth data, therefore, often have a direct impact on the Australian Dollar and its pairs.
Iron Ore is Australia’s largest export, accounting for $118 billion a year according to data from 2021, with China as its primary destination. The price of Iron Ore, therefore, can be a driver of the Australian Dollar. Generally, if the price of Iron Ore rises, AUD also goes up, as aggregate demand for the currency increases. The opposite is the case if the price of Iron Ore falls. Higher Iron Ore prices also tend to result in a greater likelihood of a positive Trade Balance for Australia, which is also positive of the AUD.
The Trade Balance, which is the difference between what a country earns from its exports versus what it pays for its imports, is another factor that can influence the value of the Australian Dollar. If Australia produces highly sought after exports, then its currency will gain in value purely from the surplus demand created from foreign buyers seeking to purchase its exports versus what it spends to purchase imports. Therefore, a positive net Trade Balance strengthens the AUD, with the opposite effect if the Trade Balance is negative.
Artigos Recomendados


