
Cardano Price Forecast: ADA rebounds as whale accumulation and positive funding rates boost sentiment
- Cardano price trades in the green on Thursday after rebounding from a key daily support on the previous day.
- Santiment data show that a certain large wallet accumulated ADA during recent dips, signaling confidence.
- Derivatives market supports recovery, with ADA’s funding rates turning positive.
Cardano (ADA) is showing signs of recovery, trading above $0.88 at the time of writing on Thursday after rebounding from key support the previous day. Santiment data shows that a large wallet accumulated ADA tokens during the recent market dips, highlighting renewed investor confidence. Derivatives data further support the recovery case, with funding rates turning positive and suggesting improving sentiment among traders.
Cardano whale wallets buy recent dips
Santiment’s Supply Distribution data indicate a potential recovery horizon for Cardano, as the number of large-wallet holders (whales) is increasing.
The metric indicates that whales holding between 10 million and 100 million ADA tokens (blue line) have accumulated 130 million tokens from Tuesday to Thursday. During the same period, wallets holding between 100,000 and 1 million ADA tokens (red line) and 1 million to 10 million (yellow line) have shed a total of 20 million tokens.
This development suggests that the second cohort of whales may have been affected by the capitulation event. In contrast, the first set of wallets seized the opportunity and accumulated Cardano at a discount.
 [08-1755748402402-1755748402414.50.28, 21 Aug, 2025].png)
Cardano’s Supply Distribution chart. Source: Santiment
Apart from whale accumulation, derivatives data also support a recovery rally for Cardano. Coinglass’s OI-Weighted Funding Rate data shows that the number of traders betting that the price of Cardano will slide further is lower than those anticipating a price increase.
The metric has flipped a positive rate and reads 0.0072% on Thursday, indicating that longs are paying shorts. Historically, as shown in the chart below, when the funding rates have flipped from negative to positive, Cardano’s price has rallied sharply, as seen on July 6.
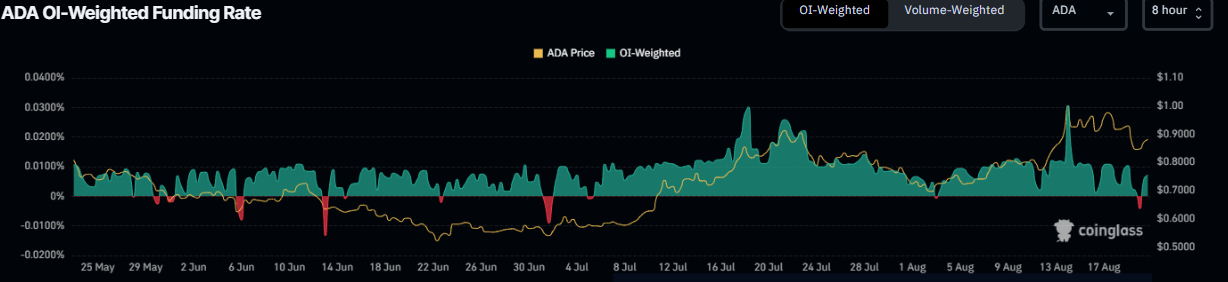
Cardano funding rate chart. Source: Coinglass
Cardano Price Forecast: Rebound in play from key daily support
Cardano price rose above its psychological level of $1 on August 14, rallying nearly 20% last week. At the start of this week, on Monday, it declined by 3.88% and extended the losses to retest its key support at $0.84 by Tuesday. However, on Wednesday, it rebounded 4%, finding support around the daily level of $0.84. At the time of writing on Thursday, it continues to recover, trading around $0.88.
If ADA continues its recovery, it could extend the rally toward its key psychological level at $1.
The Relative Strength Index (RSI) on the daily chart is around 56 after rebounding from its neutral level of 50 on Tuesday and points upward, indicating bullish momentum gaining traction. However, the Moving Average Convergence Divergence (MACD) lines converge, indicating indecisiveness among traders.
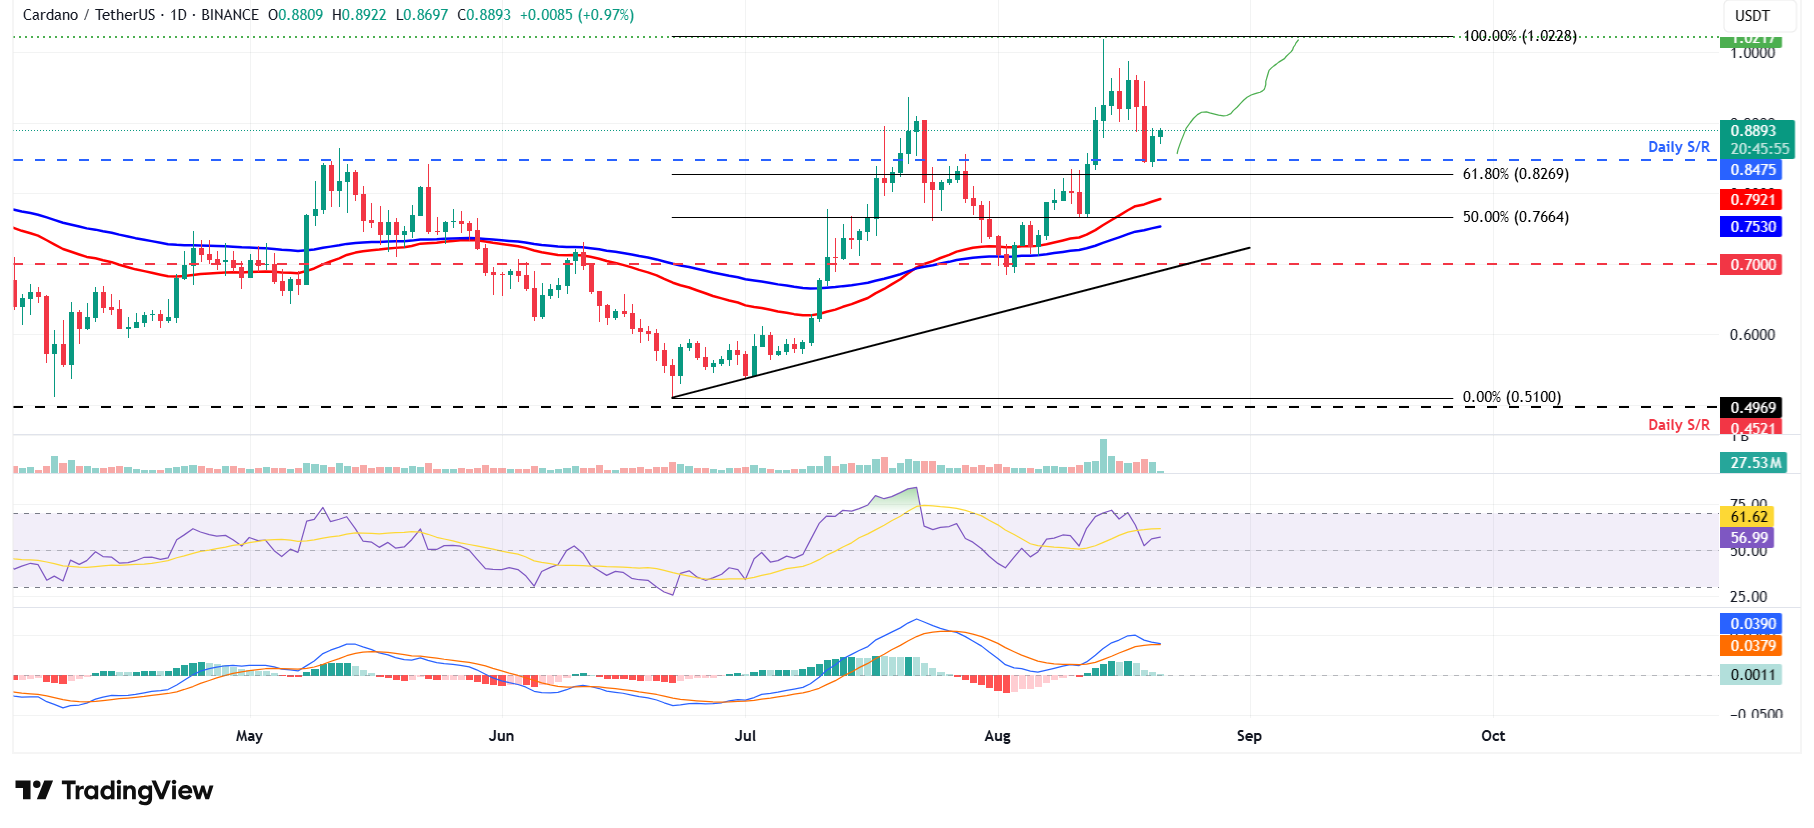
ADA/USDT daily chart
However, if ADA faces a correction, it could extend the decline toward its daily support level at $0.84.
Artigos Recomendados


