Polygon MATIC poised for 10% rally as momentum indicators signal strength
- Polygon price formed a bullish divergence on a momentum indicator, signaling a reversal.
- On-chain data shows MATIC’s capitulation event occurred between June 12 and 18.
- Supply Distribution reveals that two cohorts of whales bought as MATIC dips.
- A daily candlestick close below $0.509 would invalidate the bullish thesis.
Polygon (MATIC) price displays a bullish divergence on a momentum indicator, indicating a bullish move. Recent on-chain data reveals a capitulation event occurred from June 12 to 18, prompting a group of whales to accumulate MATIC tokens, further bolstering bullish sentiment for an upward trajectory.
MATIC sets up for a 10% rally
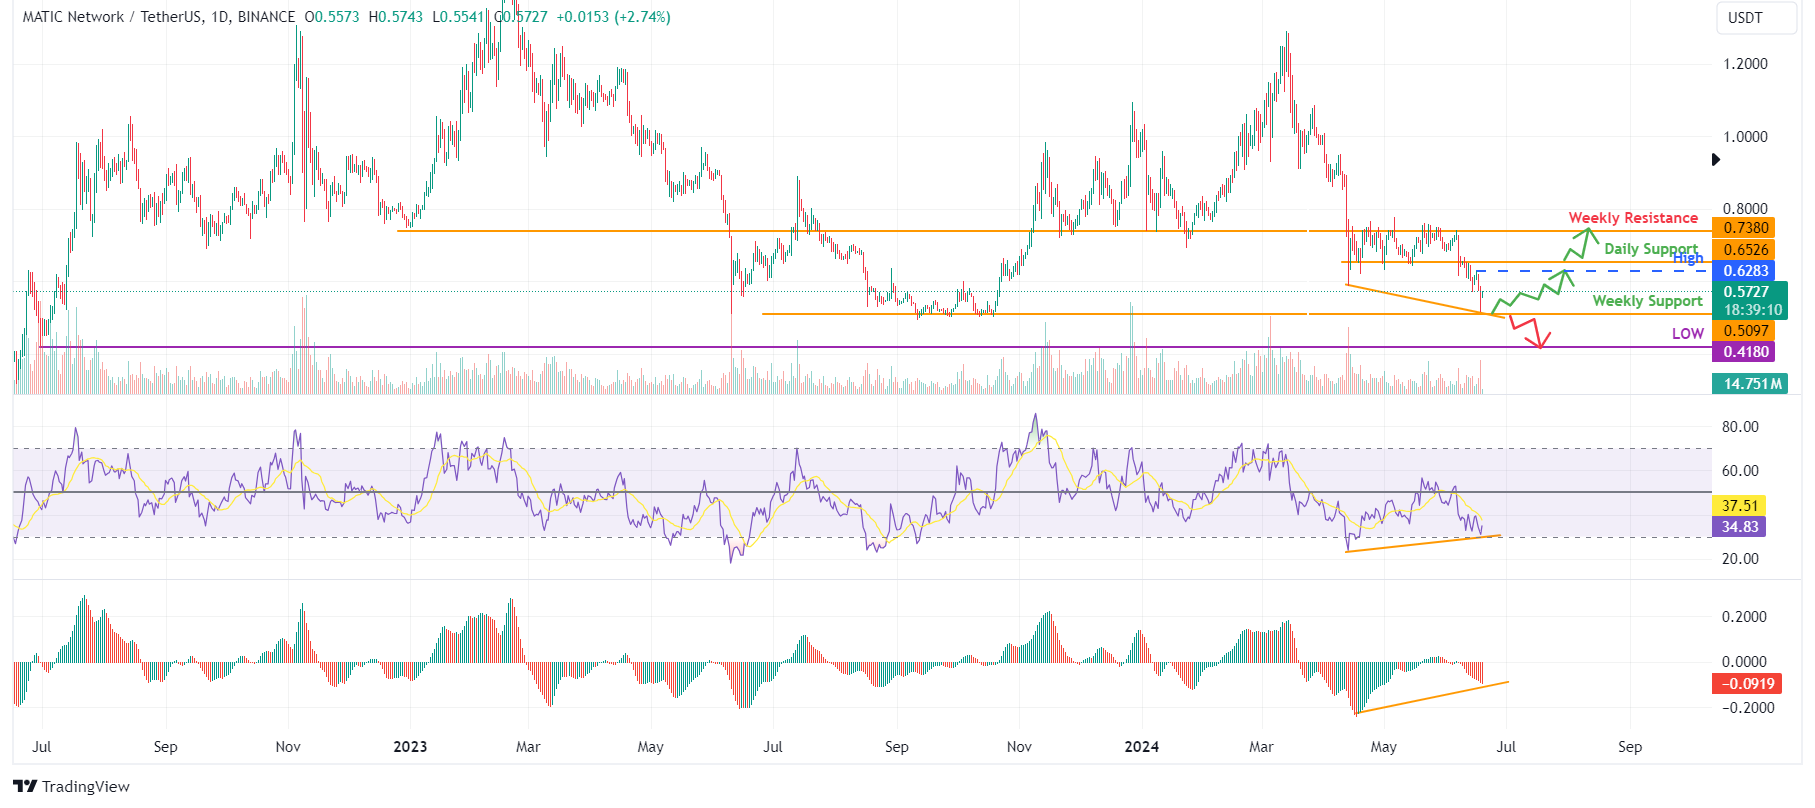
Polygon price retested its weekly support level of $0.509 on Tuesday and bounced 8% to $0.572, where it is currently trading.
Additionally, the lower low formed on June 18 does not reflect the Relative Strength Index’s (RSI) higher highs for the same period. This development is termed a bullish divergence and often leads to the reversal of the trend or a short-term rally.
If the $0.509 level holds, Matic could rally 10% from its current trading price of $0.572 to tag its daily high of $0.628 on June 16.
Moreover, if MATIC closes above the $0.652 daily resistance level, it could extend an additional 17% rally to retest its weekly resistance level of $0.738.

MATIC 1-day chart
On-chain data provider Santiment’s Network Realized Profit/Loss (NPL) indicator computes a daily network-level Return On Investment (ROI) based on the coin’s on-chain transaction volume. Simply put, it is used to measure market pain. Strong spikes in a coin’s NPL indicate that its holders are on average, selling their bags at a significant profit. On the other hand, strong dips imply that the coin’s holders are on average realizing losses, suggesting panic sell-offs and investor capitulation.
In MATIC’s case, the NPL indicator had spiked twice, -5.3 million and -3.15 million, between June 12 and 18, coinciding with a 14% price crash. This negative downtick indicates that the holders are, on average, realizing losses, suggesting panic sell-offs and investor capitulation.
 [10.28.11, 19 Jun, 2024]-638543729280164459.png)
MATIC Network Realized Profit/Loss chart
Santiment’s Supply Distribution metric shows that whales with 1 million to 10 million (Yellow line) MATIC tokens dropped from 218.82 million to 251.70 million between June 12 and 18. Meanwhile, wallet holdings of 10 million to 100 million (Blue line) and 100,000 to 1 million (Red line) MATIC tokens surged from 218.82 million to 243.09 million and 201.01 million to 206.42 million, respectively, in the same period.
This interesting development shows that the first cohort of whales could have fallen prey to the capitulation event. In contrast, the second and third sets of wallets seized the opportunity and accumulated MATIC at a discount.
 [09.49.48, 19 Jun, 2024]-638543729605773921.png)
MATIC Supply Distribution chart
Even though on-chain metrics and technical analysis point to a bullish outlook, if Polygon's price produces a daily candlestick close below $0.509, the weekly support, the move would invalidate the bullish thesis by making a lower low on the daily time frame. This development could see MATIC's price crash by 18% to retest its daily low of $0.418 from June 30, 2022.


