
Dow Jones Industrial Average rebounds after Moody’s downgrades US debt
- The Dow Jones rose on Monday, tapping the 42,800 region.
- Moody’s downgraded US debt late last week, sparking a brief hesitation in investor sentiment.
- Fedspeakers are working double duty ahead of US PMI data later this week.
The Dow Jones Industrial Average (DJIA) gained ground to kick off the new trading week, touching 42,800 for the first time in eight weeks as markets continue to push equity markets back into the high end following this year’s tariff-fueled stock rout.
Moody’s ratings agency stripped the United States (US) of its last remaining AAA rating on its Treasuries last Friday, citing burgeoning US debt and government deficits that successive presidential administrations either refuse to, or are incapable of, bringing under control. Ratings agencies began stripping AAA status from US Treasuries in 2013, and it is the first time Moody’s has downgraded the US since 1913.
Investor sentiment wobbled at the headlines, but quickly recovered and shrugged off the hit to US creditworthiness: even with decaying investment quality, there are functionally no alternatives to Treasury-quality assets, especially when considering the sheer size of the US debt market, which towers over any other potential asset.
Still, not all is perfectly rosy in the Treasury markets: 30-year yields broke above 5% on Monday, and 10-year yields traded north of 4.5%. The last time 10-year yields rose this high, this fast, the Trump administration was forced to pivot away from and effectively cancel its “reciprocal tariff” plans in April.
Fed not in a rush to meet markets in the middle on rate cuts
Federal Reserve (Fed) speakers have hit the ground running this week in an attempt to temper market expectations for rate cuts. All Fed policymakers have been gently but firmly reminding investors that the US’s still-existing tariff and trade policies make it nearly impossible to forecast the domestic economy, and adjust policy rates as a result. The Fed is firmly entrenched in wait-and-see mode, no matter how much rate markets price in future rate cuts. Even though rate traders still hold out hope for a fresh rate-cutting cycle to kick off in 2025, when those rate cuts will begin continues to march further into the calendar. According to the CME’s FedWatch Tool, rate markets are now pricing in a first quarter-point rate trim in September, well back from the June expectations that were priced in less than a month ago.
The key economic data release this week will be S&P Global Purchasing Managers Index (PMI) figures for May. According to median market forecasts, both the manufacturing and services components of the PMI report are expected to decline slightly as tariffs take a bite out of business spending activity.
Read more stock news: UnitedHealth stock fills in the gap as market assesses the bottom is in
Dow Jones price forecast
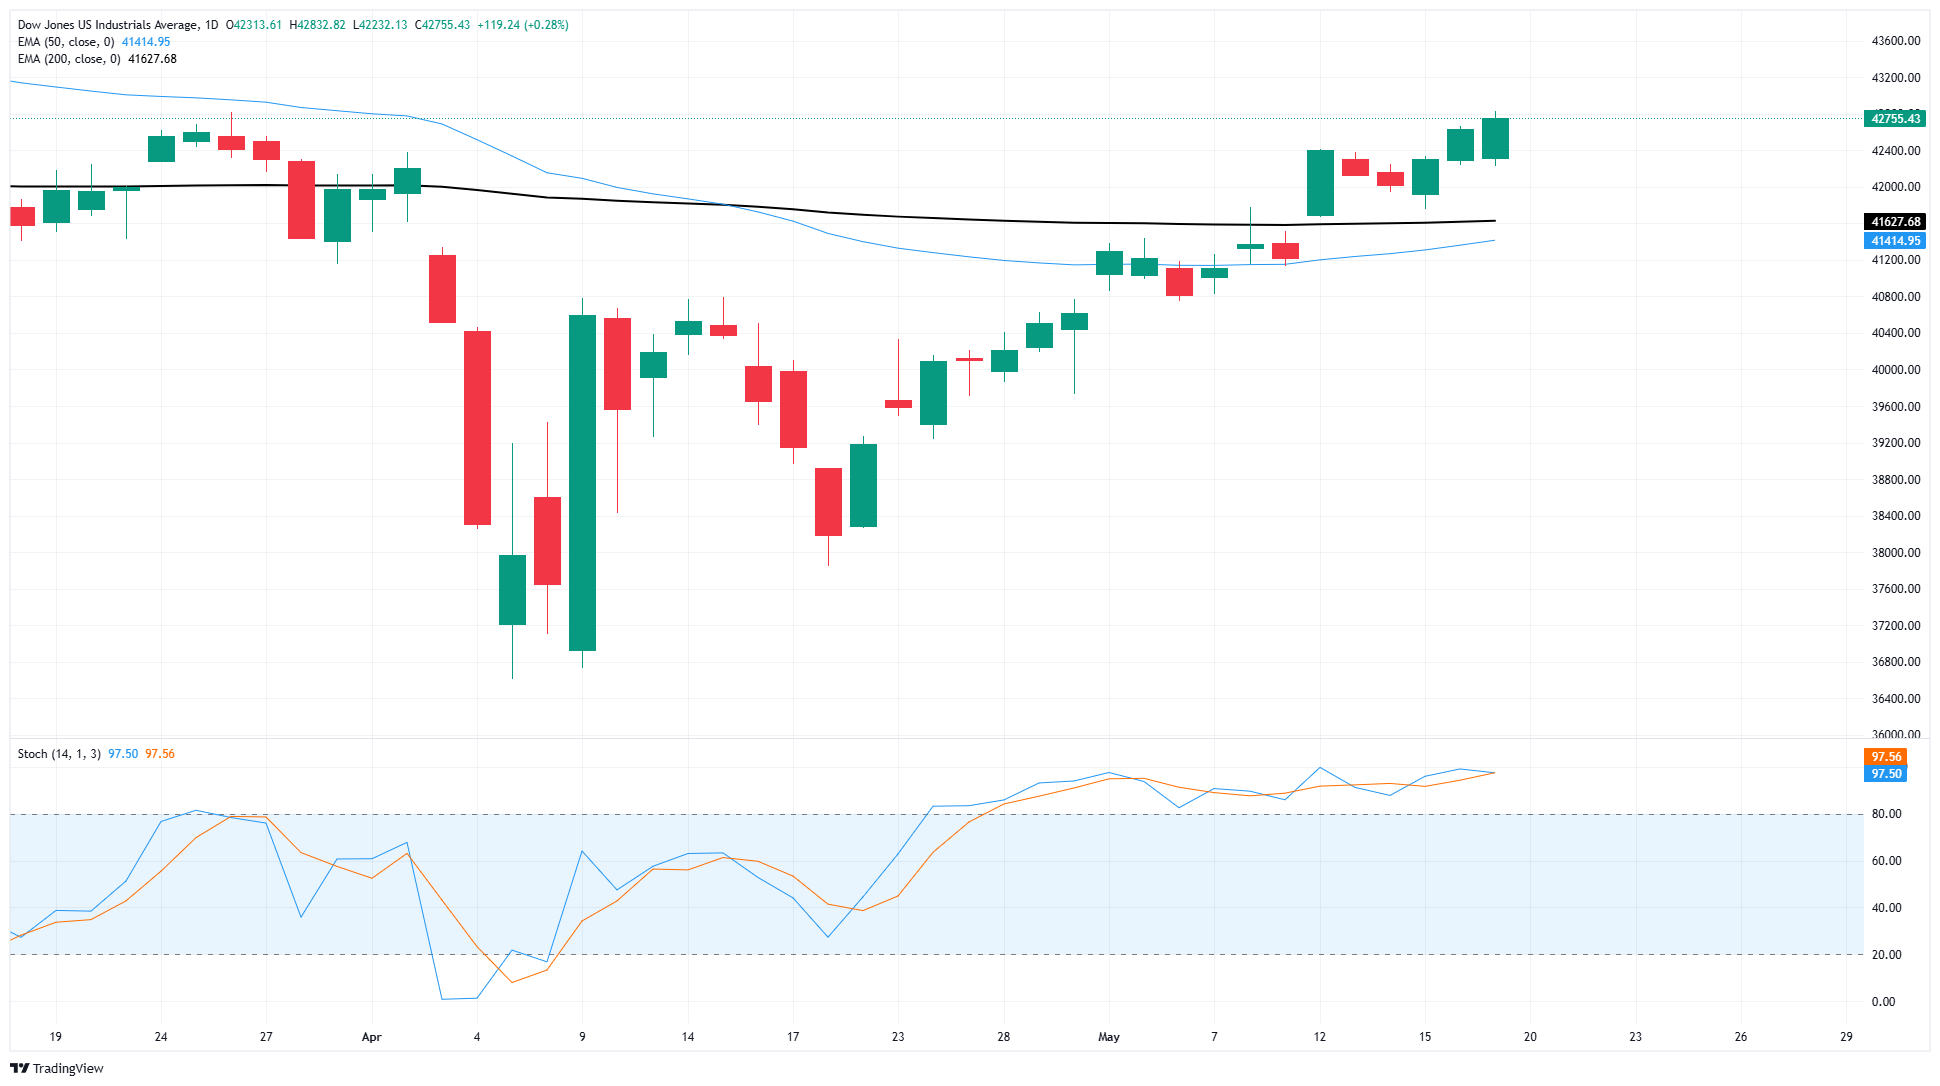
The Dow Jones Industrial Average continues to march its way back up the charts. The major equity index has closed higher for four consecutive weeks, and is already on its way to a fifth bullish week after a determined start on Monday. The Dow Jones is pushing even further above the 200-day Exponential Moving Average (EMA) near 41,500, and is up nearly 17% from April’s tariff plunge that sent the DJIA down to 36,600.
Dow Jones daily chart
Dow Jones FAQs
The Dow Jones Industrial Average, one of the oldest stock market indices in the world, is compiled of the 30 most traded stocks in the US. The index is price-weighted rather than weighted by capitalization. It is calculated by summing the prices of the constituent stocks and dividing them by a factor, currently 0.152. The index was founded by Charles Dow, who also founded the Wall Street Journal. In later years it has been criticized for not being broadly representative enough because it only tracks 30 conglomerates, unlike broader indices such as the S&P 500.
Many different factors drive the Dow Jones Industrial Average (DJIA). The aggregate performance of the component companies revealed in quarterly company earnings reports is the main one. US and global macroeconomic data also contributes as it impacts on investor sentiment. The level of interest rates, set by the Federal Reserve (Fed), also influences the DJIA as it affects the cost of credit, on which many corporations are heavily reliant. Therefore, inflation can be a major driver as well as other metrics which impact the Fed decisions.
Dow Theory is a method for identifying the primary trend of the stock market developed by Charles Dow. A key step is to compare the direction of the Dow Jones Industrial Average (DJIA) and the Dow Jones Transportation Average (DJTA) and only follow trends where both are moving in the same direction. Volume is a confirmatory criteria. The theory uses elements of peak and trough analysis. Dow’s theory posits three trend phases: accumulation, when smart money starts buying or selling; public participation, when the wider public joins in; and distribution, when the smart money exits.
There are a number of ways to trade the DJIA. One is to use ETFs which allow investors to trade the DJIA as a single security, rather than having to buy shares in all 30 constituent companies. A leading example is the SPDR Dow Jones Industrial Average ETF (DIA). DJIA futures contracts enable traders to speculate on the future value of the index and Options provide the right, but not the obligation, to buy or sell the index at a predetermined price in the future. Mutual funds enable investors to buy a share of a diversified portfolio of DJIA stocks thus providing exposure to the overall index.
추천 기사


