

US Dollar flat amidst surprise Copper tariffs to come soon, Russia-Ukraine negotiations
- Markets are digesting recent announcements on Copper tariffs and Russia-Ukraine negotiations.
- US President Trump mentioned Copper tariffs are coming sooner than anticipated.
- The US Dollar Index sees support at 104.00 and is consolidating this Wednesday ahead of US Durable Goods Orders.
The US Dollar Index (DXY), which tracks the performance of the US Dollar (USD) against six major currencies, is currently bouncing off the 104.00 mark and consolidates on Wednesday ahead of the US Durable Goods Orders data for February.
On one hand, the DXY sees some selling pressure from a Black Sea ceasefire deal brokered by the United States (US), where Ukraine is willing to commit and Russia backtracks and demands a lift in all sanctions on banks and agricultural companies.
On the other hand, the buying pressure comes from comments from US President Donald Trump, who said Copper tariffs are coming in a couple of weeks, much sooner than markets anticipated.
On the economic data front, all eyes are on the February Durable Goods Orders. Expectations are already quite bearish, with a 1% contraction for the forecast number compared to the previous month’s 3.2% increase. On the Federal Reserve (Fed) front, Minneapolis Fed President Neel Kashkarai and St Louis Fed President Alberto Musalem are due to speak later this Wednesday.
Daily digest market movers: Durable Goods to set the tone
- At 11:00 GMT, the Mortgage Bankers Association (MBA) released the weekly Mortgage Applications number. This week’s number came in at -2% compared to the previous contraction of 6.2%.
- At 12:30 GMT, the February Durable Goods Orders data are due:
- The headline Orders are expected to come in at -1%, a substantial drop from the previous 3.2%.
- Durable Goods excluding Transportation are expected to tick up to 0.2% from 0.0% in the previous month.
- Around 14:00 GMT, the President of the Federal Reserve Bank of Minneapolis, Neel Kashkari, will host a Fed Listens event and conversation at the Detroit Lakes Regional Chamber of Commerce Economic Summit of Detroit Lakes, Minnesota.
- Just 10 minutes after Fed's Kashkari, St. Louis Fed President Alberto Musalem will speak at the Paducah Area Chamber of Commerce/Greater Paducah Economic Development Luncheon.
- Equities are not breaking any pots this Wednesday, with slim gains in Asia and minor losses in Europe and in the US futures.
- According to the CME Fedwatch Tool, the probability of interest rates remaining at the current range of 4.25%-4.50% in May’s meeting is 88.4%. For June, the odds for borrowing costs being lower stand at 65.6%.
- The US 10-year yield trades around 4.31%, with bond traders looking for direction on these offsetting events in Ukraine and US tariffs.
US Dollar Index Technical Analysis: Push and Pull
The US Dollar Index (DXY) consolidates this Wednesday. Technically, support at 104.00 is good for a bounce, while concerns on tariffs and the impact on the US economy are supporting the US Dollar’s strength. On the contrary, the ongoing talks for a Russia-Ukraine peace deal mean that a sigh of relief could ripple through markets, weighing on the US Dollar.
With the weekly close above 104.00 last week, a large sprint higher towards the 105.00 round level could still occur, with the 200-day Simple Moving Average (SMA) converging at that point and reinforcing this area as a strong resistance at 104.96. Once broken through that zone, a string of pivotal levels, such as 105.53 and 105.89, could limit the upward momentum.
On the downside, the 104.00 round level is the first nearby support after a successful bounce on Tuesday. If that does not hold, the DXY risks falling back into that March range between 104.00 and 103.00. Once the lower end at 103.00 gives way, watch out for 101.90 on the downside.
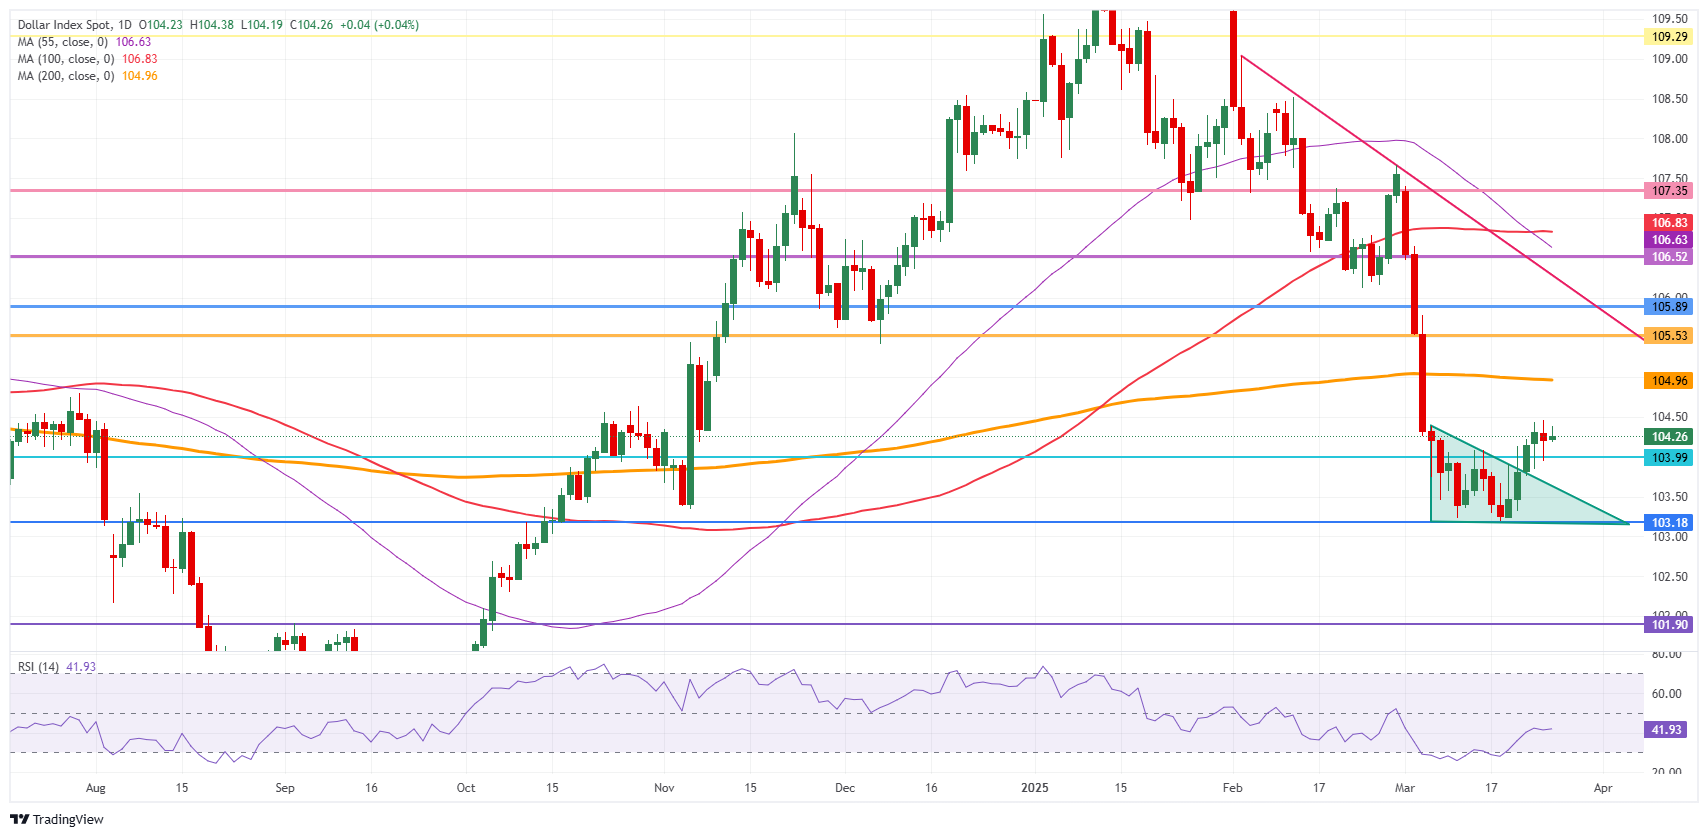
US Dollar Index: Daily Chart
US Dollar FAQs
The US Dollar (USD) is the official currency of the United States of America, and the ‘de facto’ currency of a significant number of other countries where it is found in circulation alongside local notes. It is the most heavily traded currency in the world, accounting for over 88% of all global foreign exchange turnover, or an average of $6.6 trillion in transactions per day, according to data from 2022. Following the second world war, the USD took over from the British Pound as the world’s reserve currency. For most of its history, the US Dollar was backed by Gold, until the Bretton Woods Agreement in 1971 when the Gold Standard went away.
The most important single factor impacting on the value of the US Dollar is monetary policy, which is shaped by the Federal Reserve (Fed). The Fed has two mandates: to achieve price stability (control inflation) and foster full employment. Its primary tool to achieve these two goals is by adjusting interest rates. When prices are rising too quickly and inflation is above the Fed’s 2% target, the Fed will raise rates, which helps the USD value. When inflation falls below 2% or the Unemployment Rate is too high, the Fed may lower interest rates, which weighs on the Greenback.
In extreme situations, the Federal Reserve can also print more Dollars and enact quantitative easing (QE). QE is the process by which the Fed substantially increases the flow of credit in a stuck financial system. It is a non-standard policy measure used when credit has dried up because banks will not lend to each other (out of the fear of counterparty default). It is a last resort when simply lowering interest rates is unlikely to achieve the necessary result. It was the Fed’s weapon of choice to combat the credit crunch that occurred during the Great Financial Crisis in 2008. It involves the Fed printing more Dollars and using them to buy US government bonds predominantly from financial institutions. QE usually leads to a weaker US Dollar.
Quantitative tightening (QT) is the reverse process whereby the Federal Reserve stops buying bonds from financial institutions and does not reinvest the principal from the bonds it holds maturing in new purchases. It is usually positive for the US Dollar.
추천 기사


