

US Dollar goes nowhere with traders eyeing US-Russia talks to end Ukraine war
- The US Dollar is bearing minor gains and losses against most major currencies.
- Traders are on edge over any possible headlines on US-Russia talks that might come out of Saudi Arabia this Tuesday.
- The US Dollar Index (DXY) resides and looks for a direction in the 106.50-107.00 region.
The US Dollar Index (DXY), which tracks the performance of the US Dollar (USD) against six major currencies, is bracing for a possible pivotal outcome and trades slightly below 107.00 at the time of writing on Tuesday. Several United States (US) officials are meeting Russian counterparts this Tuesday in Riyadh, Saudi Arabia, to work out a ceasefire or peace deal for Ukraine. European leaders also met on Monday night to discuss a united peace force and boost military spending in the region.
The economic calendar is again rather calm on Tuesday. The main event that could move markets is the New York Empire State Manufacturing Index data for February. Expectations are that manufacturing sector business activity declined in New York but at a slower pace than in January.
Daily digest market movers: Keep your ear on the squawk
- Traders will need to be vigilant for any headlines coming out of Riyadh, where US and Russian officials are meeting for talks in the runup to the first meeting between US President Donald Trump and Russian President Vladimir Putin to agree on a deal to end the war.
- At 13:30 GMT, the New York Empire State Manufacturing Index for February is expected to come in still in contraction but at a slower pace than in January, falling to -1 compared to the previous -12.60.
- At 15:00 GMT, the National Association of Home Builders (NAHB) will release its Housing Market Index for February, which is expected to rise steadily by 47, from 47 in January.
- Federal Reserve Bank of San Francisco President Mary Daly and Federal Reserve Vice Chair for Supervision Michael Barr will speak later this Tuesday at 15:20 GMT and 18:00 GMT, respectively.
- Equities are mixed going into this Tuesday. European ones are struggling while US futures are in the green.
- The CME FedWatch tool shows a 49.8% chance that interest rates will remain unchanged at current levels in June.
- The US 10-year yield is trading around 4.51% and will remain closed for trading this Monday.
US Dollar Index Technical Analysis: Uncertainty across
The US Dollar Index (DXY) is facing too many loose ends to choose a surefooted direction. Plenty of catalysts and headlines are still expected, ranging from headlines on Ukraine and Europe to more details on US President Trump’s reciprocal tariffs, all ahead of this weekend’s German election. The US Dollar could start to outperform if a peace deal is brokered without Europe, missing the opportunity to play an important role in the new world order.
On the upside, the previous support at 107.35 has now turned into a firm resistance. Further up, the 55-day SMA at 107.92 must be regained before reclaiming 108.00.
On the downside, look for 106.52 (April 16, 2024, high), 106.45 (100-day SMA), or even 105.89 (resistance in June 2024) as support levels. As the Relative Strength Index (RSI) momentum indicator in the daily chart shows room for more downside, the 200-day SMA at 104.94 could be a possible outcome.
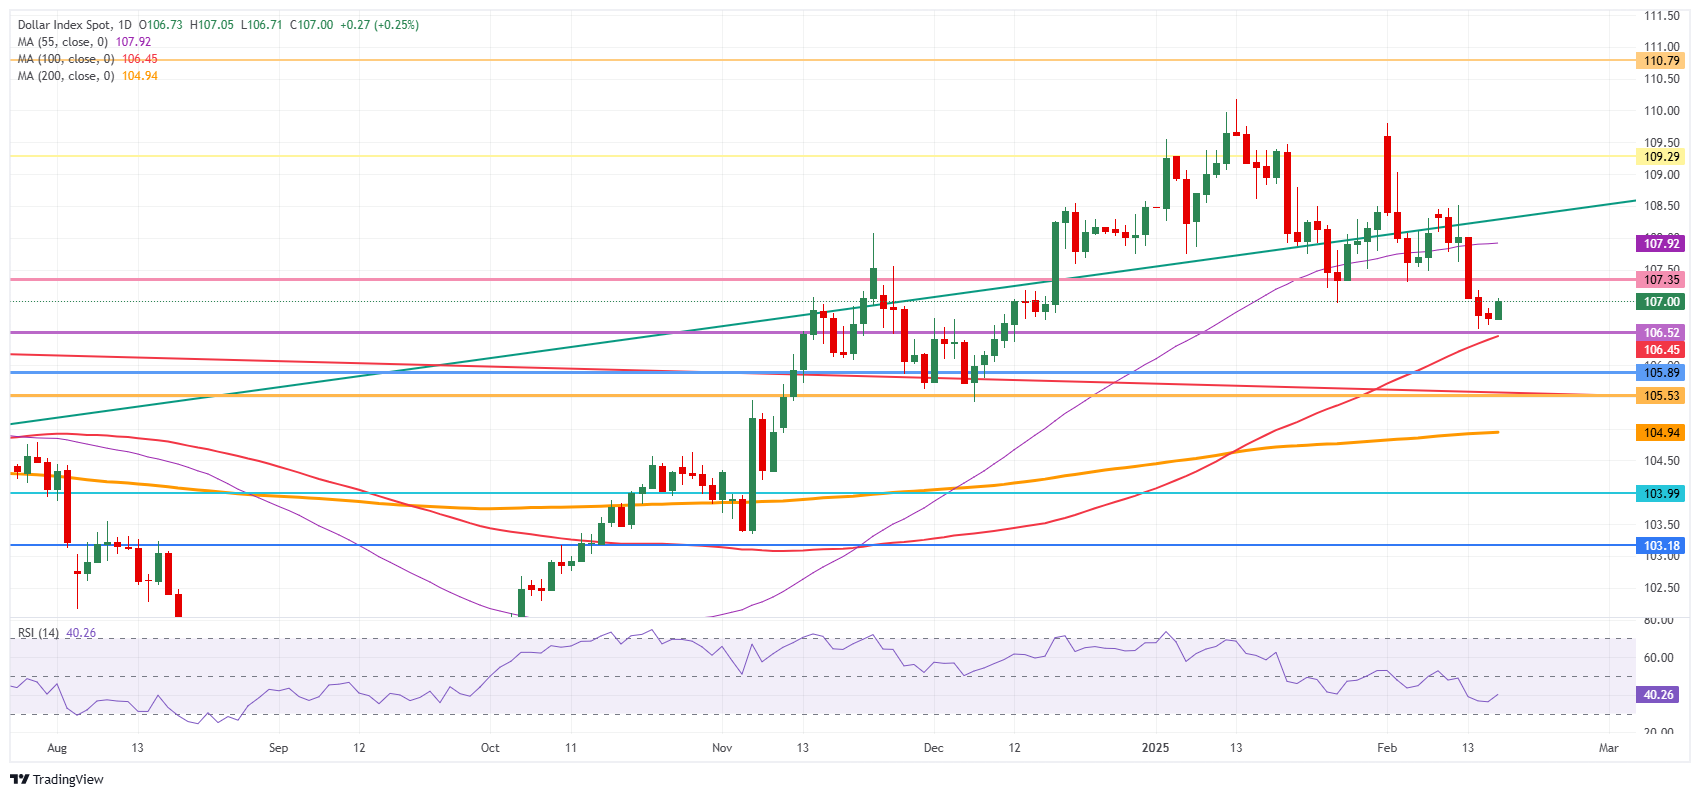
US Dollar Index: Daily Chart
US Dollar FAQs
The US Dollar (USD) is the official currency of the United States of America, and the ‘de facto’ currency of a significant number of other countries where it is found in circulation alongside local notes. It is the most heavily traded currency in the world, accounting for over 88% of all global foreign exchange turnover, or an average of $6.6 trillion in transactions per day, according to data from 2022. Following the second world war, the USD took over from the British Pound as the world’s reserve currency. For most of its history, the US Dollar was backed by Gold, until the Bretton Woods Agreement in 1971 when the Gold Standard went away.
The most important single factor impacting on the value of the US Dollar is monetary policy, which is shaped by the Federal Reserve (Fed). The Fed has two mandates: to achieve price stability (control inflation) and foster full employment. Its primary tool to achieve these two goals is by adjusting interest rates. When prices are rising too quickly and inflation is above the Fed’s 2% target, the Fed will raise rates, which helps the USD value. When inflation falls below 2% or the Unemployment Rate is too high, the Fed may lower interest rates, which weighs on the Greenback.
In extreme situations, the Federal Reserve can also print more Dollars and enact quantitative easing (QE). QE is the process by which the Fed substantially increases the flow of credit in a stuck financial system. It is a non-standard policy measure used when credit has dried up because banks will not lend to each other (out of the fear of counterparty default). It is a last resort when simply lowering interest rates is unlikely to achieve the necessary result. It was the Fed’s weapon of choice to combat the credit crunch that occurred during the Great Financial Crisis in 2008. It involves the Fed printing more Dollars and using them to buy US government bonds predominantly from financial institutions. QE usually leads to a weaker US Dollar.
Quantitative tightening (QT) is the reverse process whereby the Federal Reserve stops buying bonds from financial institutions and does not reinvest the principal from the bonds it holds maturing in new purchases. It is usually positive for the US Dollar.
추천 기사


