

US Dollar struggles to sustain momentum as markets digest PPI and geopolitical developments
- The US Dollar Index plummeted on Thursday, failing to hold gains after Wednesday's inflation-driven rally.
- Stronger-than-expected Producer Price Index data initially supported the Greenback but was offset by geopolitical headlines.
- President Trump and Russian President Putin agreed to begin peace talks with Ukraine, reducing market risk aversion.
- Jobless claims data came in slightly better than expected, reinforcing resilience in the US labor market.
The US Dollar Index (DXY), which measures the value of the US Dollar against a basket of currencies, struggles to hold onto gains following Wednesday’s inflation data. Traders are quick to dismiss the latest Producer Price Index (PPI) figures, shifting their focus to geopolitical developments.
A potential peace agreement between Russia and Ukraine and the latest US jobless claims data add to the market’s uncertainty, leaving the DXY below 107.30.
Daily digest market movers: US Dollar fails to capitalize on strong PPI data
- The PPI for January increased by 0.4%, exceeding the expected 0.3%, but came down from a revised 0.5% prior.
- Core PPI matched expectations at 0.3%, but December’s figure was revised higher to 0.4%, signaling persistent price pressure.
- Initial Jobless Claims fell to 213,000 for the week ending February 7, slightly below the forecast of 215,000.
- Continuing Jobless Claims dropped to 1.850 million, below the projected 1.880 million, highlighting labor market resilience.
- A surprise geopolitical development saw President Trump and President Putin agreeing to begin peace negotiations with Ukraine, which sparked a wave of optimism.
- On the Federal Reserve’s side, its stance remains cautious with officials set to provide further guidance on the monetary policy outlook.
- The Federal Sentiment Index remains unchanged but is still in hawkish territory, signaling policymakers’ reluctance to ease prematurely.
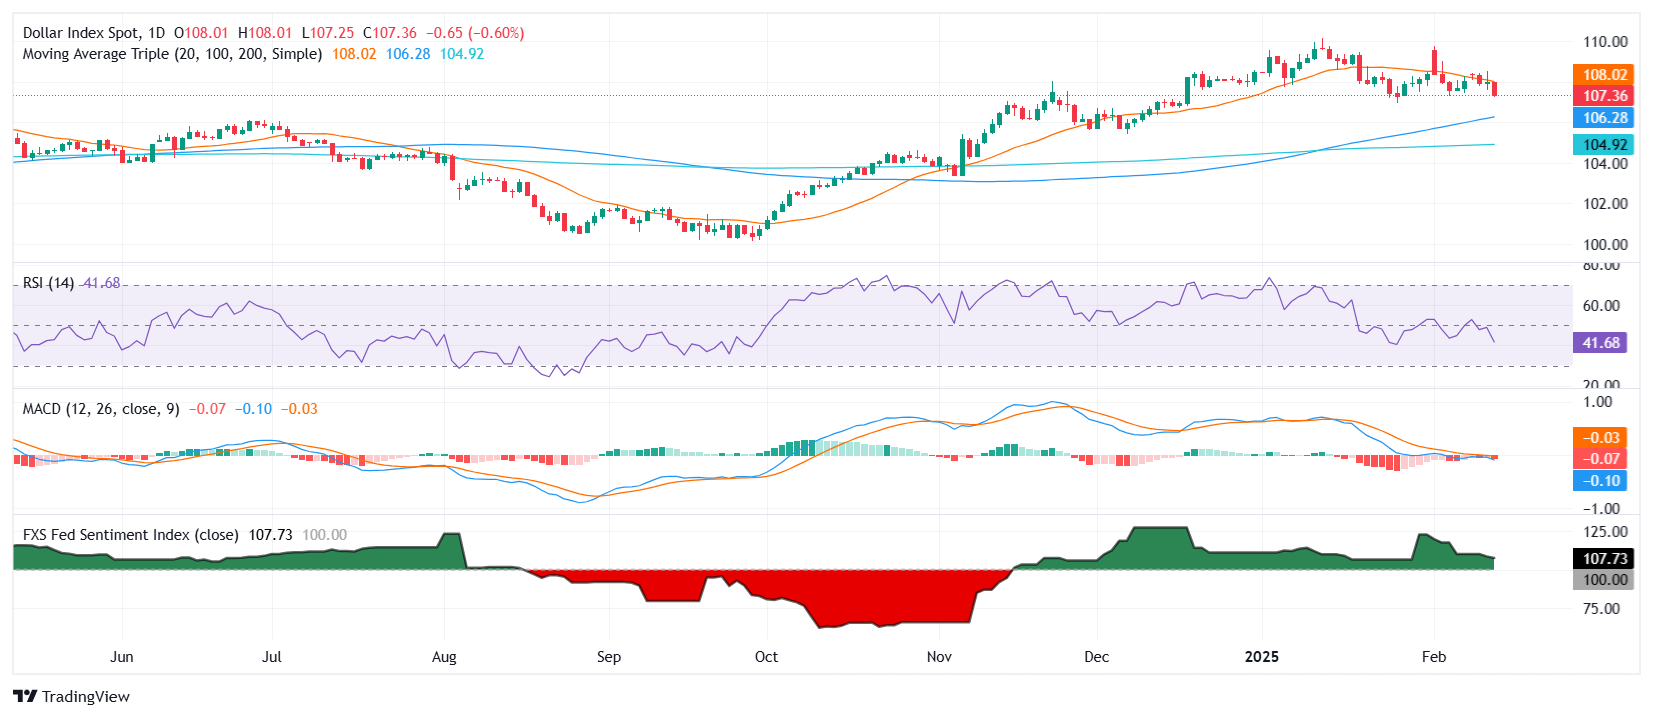
DXY technical outlook: Index loses grip of 20-day moving average as bearish pressure mounts
The US Dollar Index struggles to hold above the 20-day Simple Moving Average (SMA), signaling weakness after failing to sustain Wednesday’s gains. The Relative Strength Index (RSI) remains below 50, pointing to persistent bearish momentum, while the Moving Average Convergence Divergence (MACD) continues to show a negative trend.
Immediate resistance stands at 108.50 with support near 107.80. A break below this level could accelerate declines toward the psychological 107.00 mark.
US Dollar FAQs
The US Dollar (USD) is the official currency of the United States of America, and the ‘de facto’ currency of a significant number of other countries where it is found in circulation alongside local notes. It is the most heavily traded currency in the world, accounting for over 88% of all global foreign exchange turnover, or an average of $6.6 trillion in transactions per day, according to data from 2022. Following the second world war, the USD took over from the British Pound as the world’s reserve currency. For most of its history, the US Dollar was backed by Gold, until the Bretton Woods Agreement in 1971 when the Gold Standard went away.
The most important single factor impacting on the value of the US Dollar is monetary policy, which is shaped by the Federal Reserve (Fed). The Fed has two mandates: to achieve price stability (control inflation) and foster full employment. Its primary tool to achieve these two goals is by adjusting interest rates. When prices are rising too quickly and inflation is above the Fed’s 2% target, the Fed will raise rates, which helps the USD value. When inflation falls below 2% or the Unemployment Rate is too high, the Fed may lower interest rates, which weighs on the Greenback.
In extreme situations, the Federal Reserve can also print more Dollars and enact quantitative easing (QE). QE is the process by which the Fed substantially increases the flow of credit in a stuck financial system. It is a non-standard policy measure used when credit has dried up because banks will not lend to each other (out of the fear of counterparty default). It is a last resort when simply lowering interest rates is unlikely to achieve the necessary result. It was the Fed’s weapon of choice to combat the credit crunch that occurred during the Great Financial Crisis in 2008. It involves the Fed printing more Dollars and using them to buy US government bonds predominantly from financial institutions. QE usually leads to a weaker US Dollar.
Quantitative tightening (QT) is the reverse process whereby the Federal Reserve stops buying bonds from financial institutions and does not reinvest the principal from the bonds it holds maturing in new purchases. It is usually positive for the US Dollar.
추천 기사


