

Dow Jones Industrial Average trades steady post-Powell
- The Dow Jones held steady as investors digest Fed Chair remarks.
- Markets are brushing off the latest batch of tariff threats.
- Key US inflation data looms ahead this week.
The Dow Jones Industrial Average (DJIA) is mostly on balance on Tuesday, holding steady near 44,500 after Federal Reserve (Fed) Chair Jerome Powell signaled that the Fed is willing to wait as long as necessary to make sure the economy is stable and further progress on inflation will be made before cutting rates again. United States (US) President Donald Trump escalated his ongoing efforts to spark a global trade war between the US and everybody else. Investors are banking on another last-minute resolution and shrugging off President Trump’s tariff bluster.
Jerome Powell Testimony Live: Not for the Fed to comment on tariff policy
Fed Chair Powell reiterated most of his recent talking points when he presented the Fed’s Monetary Policy Report to the Senate Banking Committee on Tuesday. The Fed head noted that neutral rates have likely risen since the 2020 pandemic and that the Fed is comfortable holding interest rates where they are for the time being unless a drastic shift in US labor or inflation figures presents itself.
US President Donald Trump launched a fresh round of tariff threats this week, but market participants are getting used to his “all bark, no bite” approach to blustery trade statements. Since the pre-election campaign trail, President Trump has been kicking the can down the road on his own tariff threats, promising day-one widespread tariffs that have yet to appear outside of a meager tariff increase on Chinese goods.
The latest batch of still-hypothetical tariffs that Donald Trump signed into pseudo-existence this week is a wide, catch-all 25% tariff on all steel and aluminum imports into the US, with warnings that the Trump administration will give no exemptions or exceptions to anyone, and will be looking at automobiles and microchips next. According to reporting, potential exemptions have already been floated toward both Australia and China, and the tariffs themselves may not come into effect until March 12. After a heady spin around the tariff threat carousel last week, investors are now chalking President Trump’s tariff threats up to strong-armed negotiating, and that another reason to stall actually implementing the tariffs will be found at the eleventh hour.
Dow Jones news
The Dow Jones is roughly balanced at the midpoint on Tuesday, though some major players are finding room to move higher and keeping the index tilted into the bullish side. Salesforce (CRM) withered around 1.4% to fall below $323 per share as the AI-driven tech sector stutters. Coca-Cola (KO) rose 3.5%, climbing to $67 per share after beating Wall Street earnings forecasts, and Apple also gained ground, moving 3.2% higher to $235 per share.
Dow Jones price forecast
The Dow Jones is looking higher but treading water for the time being, holding close to record high territory as bidders try to gather momentum. The major equity index got knocked lower last week on tariff threats, testing the 44,00 handle, but investor risk appetite remained firm enough to find a technical floor and keep price action on the high side.
The trend is still leaning into the top end, but it’s been a while since the Dow Jones could chalk in a new record high, with 45,071 being the current number to beat, set in late November. The ongoing bullish trend remains well intact, with DJIA outrunning its own 200-day Exponential Moving Average (EMA) for 15 straight months. The 200-day EMA is well below current price action, rising into the 42,000 level.
Dow Jones daily chart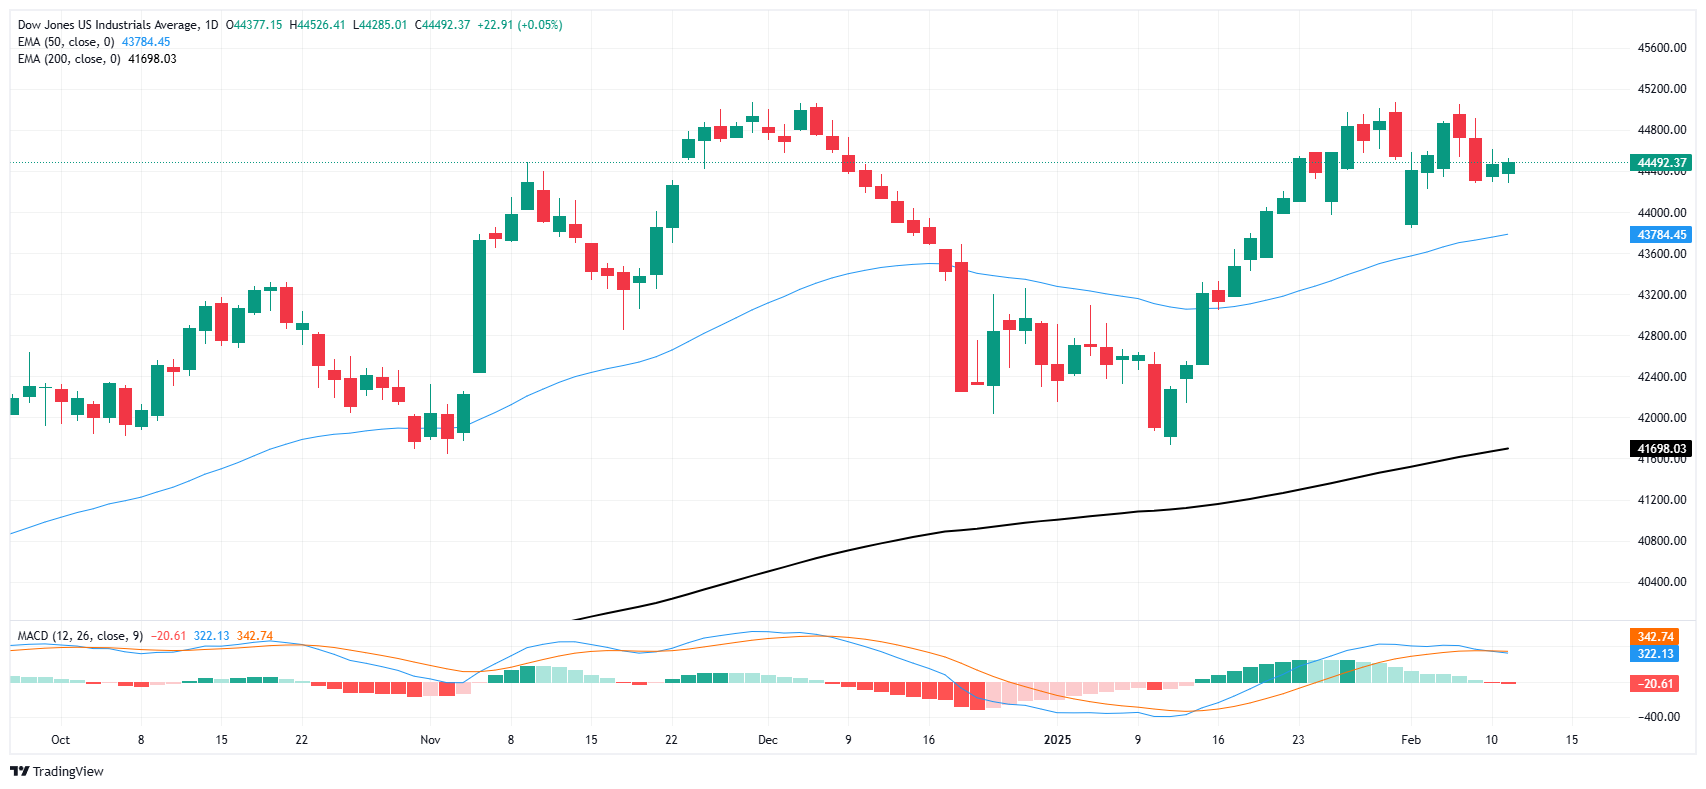
Dow Jones FAQs
The Dow Jones Industrial Average, one of the oldest stock market indices in the world, is compiled of the 30 most traded stocks in the US. The index is price-weighted rather than weighted by capitalization. It is calculated by summing the prices of the constituent stocks and dividing them by a factor, currently 0.152. The index was founded by Charles Dow, who also founded the Wall Street Journal. In later years it has been criticized for not being broadly representative enough because it only tracks 30 conglomerates, unlike broader indices such as the S&P 500.
Many different factors drive the Dow Jones Industrial Average (DJIA). The aggregate performance of the component companies revealed in quarterly company earnings reports is the main one. US and global macroeconomic data also contributes as it impacts on investor sentiment. The level of interest rates, set by the Federal Reserve (Fed), also influences the DJIA as it affects the cost of credit, on which many corporations are heavily reliant. Therefore, inflation can be a major driver as well as other metrics which impact the Fed decisions.
Dow Theory is a method for identifying the primary trend of the stock market developed by Charles Dow. A key step is to compare the direction of the Dow Jones Industrial Average (DJIA) and the Dow Jones Transportation Average (DJTA) and only follow trends where both are moving in the same direction. Volume is a confirmatory criteria. The theory uses elements of peak and trough analysis. Dow’s theory posits three trend phases: accumulation, when smart money starts buying or selling; public participation, when the wider public joins in; and distribution, when the smart money exits.
There are a number of ways to trade the DJIA. One is to use ETFs which allow investors to trade the DJIA as a single security, rather than having to buy shares in all 30 constituent companies. A leading example is the SPDR Dow Jones Industrial Average ETF (DIA). DJIA futures contracts enable traders to speculate on the future value of the index and Options provide the right, but not the obligation, to buy or sell the index at a predetermined price in the future. Mutual funds enable investors to buy a share of a diversified portfolio of DJIA stocks thus providing exposure to the overall index.
추천 기사


